Brazilian vs South African Doctorate Degree
COMPARE
Brazilian
South African
Doctorate Degree
Doctorate Degree Comparison
Brazilians
South Africans
2.1%
DOCTORATE DEGREE
97.2/ 100
METRIC RATING
110th/ 347
METRIC RANK
2.3%
DOCTORATE DEGREE
99.9/ 100
METRIC RATING
59th/ 347
METRIC RANK
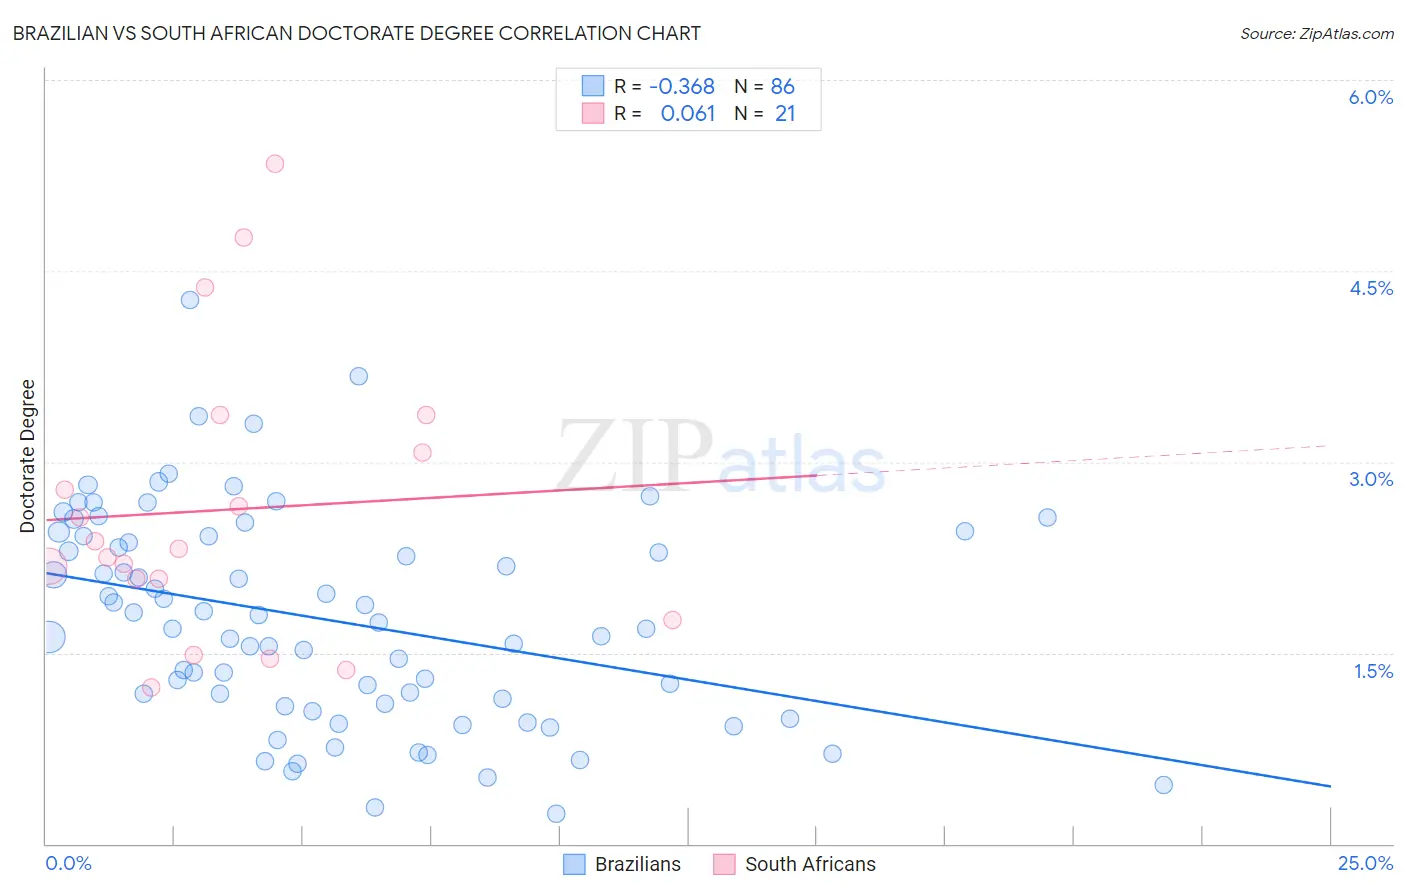
Brazilian vs South African Doctorate Degree Correlation Chart
The statistical analysis conducted on geographies consisting of 322,140,848 people shows a mild negative correlation between the proportion of Brazilians and percentage of population with at least doctorate degree education in the United States with a correlation coefficient (R) of -0.368 and weighted average of 2.1%. Similarly, the statistical analysis conducted on geographies consisting of 182,049,021 people shows a slight positive correlation between the proportion of South Africans and percentage of population with at least doctorate degree education in the United States with a correlation coefficient (R) of 0.061 and weighted average of 2.3%, a difference of 12.6%.
Doctorate Degree Correlation Summary
| Measurement | Brazilian | South African |
| Minimum | 0.24% | 1.2% |
| Maximum | 4.3% | 5.3% |
| Range | 4.0% | 4.1% |
| Mean | 1.8% | 2.6% |
| Median | 1.7% | 2.3% |
| Interquartile 25% (IQ1) | 1.1% | 1.9% |
| Interquartile 75% (IQ3) | 2.4% | 3.2% |
| Interquartile Range (IQR) | 1.3% | 1.3% |
| Standard Deviation (Sample) | 0.83% | 1.1% |
| Standard Deviation (Population) | 0.82% | 1.1% |
Similar Demographics by Doctorate Degree
Demographics Similar to Brazilians by Doctorate Degree
In terms of doctorate degree, the demographic groups most similar to Brazilians are Immigrants from Pakistan (2.1%, a difference of 0.060%), Ukrainian (2.1%, a difference of 0.070%), Syrian (2.1%, a difference of 0.080%), Immigrants from Germany (2.1%, a difference of 0.13%), and Immigrants from Italy (2.1%, a difference of 0.29%).
| Demographics | Rating | Rank | Doctorate Degree |
| Romanians | 98.1 /100 | #103 | Exceptional 2.1% |
| Austrians | 98.0 /100 | #104 | Exceptional 2.1% |
| Arabs | 97.8 /100 | #105 | Exceptional 2.1% |
| Sudanese | 97.7 /100 | #106 | Exceptional 2.1% |
| Europeans | 97.5 /100 | #107 | Exceptional 2.1% |
| Immigrants | Germany | 97.3 /100 | #108 | Exceptional 2.1% |
| Ukrainians | 97.2 /100 | #109 | Exceptional 2.1% |
| Brazilians | 97.2 /100 | #110 | Exceptional 2.1% |
| Immigrants | Pakistan | 97.1 /100 | #111 | Exceptional 2.1% |
| Syrians | 97.1 /100 | #112 | Exceptional 2.1% |
| Immigrants | Italy | 96.9 /100 | #113 | Exceptional 2.1% |
| Immigrants | Croatia | 96.8 /100 | #114 | Exceptional 2.1% |
| Taiwanese | 96.7 /100 | #115 | Exceptional 2.1% |
| Maltese | 96.2 /100 | #116 | Exceptional 2.1% |
| Lebanese | 96.0 /100 | #117 | Exceptional 2.1% |
Demographics Similar to South Africans by Doctorate Degree
In terms of doctorate degree, the demographic groups most similar to South Africans are Immigrants from Serbia (2.3%, a difference of 0.020%), Ethiopian (2.3%, a difference of 0.44%), Immigrants from Ethiopia (2.4%, a difference of 0.56%), Bhutanese (2.3%, a difference of 0.79%), and Immigrants from Czechoslovakia (2.4%, a difference of 1.0%).
| Demographics | Rating | Rank | Doctorate Degree |
| Bulgarians | 100.0 /100 | #52 | Exceptional 2.4% |
| Immigrants | Latvia | 100.0 /100 | #53 | Exceptional 2.4% |
| Immigrants | Indonesia | 100.0 /100 | #54 | Exceptional 2.4% |
| Bolivians | 100.0 /100 | #55 | Exceptional 2.4% |
| Immigrants | Czechoslovakia | 100.0 /100 | #56 | Exceptional 2.4% |
| Immigrants | Ethiopia | 100.0 /100 | #57 | Exceptional 2.4% |
| Ethiopians | 99.9 /100 | #58 | Exceptional 2.3% |
| South Africans | 99.9 /100 | #59 | Exceptional 2.3% |
| Immigrants | Serbia | 99.9 /100 | #60 | Exceptional 2.3% |
| Bhutanese | 99.9 /100 | #61 | Exceptional 2.3% |
| Immigrants | Europe | 99.9 /100 | #62 | Exceptional 2.3% |
| Laotians | 99.9 /100 | #63 | Exceptional 2.3% |
| Immigrants | Greece | 99.9 /100 | #64 | Exceptional 2.3% |
| Paraguayans | 99.9 /100 | #65 | Exceptional 2.3% |
| Argentineans | 99.9 /100 | #66 | Exceptional 2.3% |