Brazilian vs Potawatomi Doctorate Degree
COMPARE
Brazilian
Potawatomi
Doctorate Degree
Doctorate Degree Comparison
Brazilians
Potawatomi
2.1%
DOCTORATE DEGREE
97.2/ 100
METRIC RATING
110th/ 347
METRIC RANK
1.6%
DOCTORATE DEGREE
1.6/ 100
METRIC RATING
249th/ 347
METRIC RANK
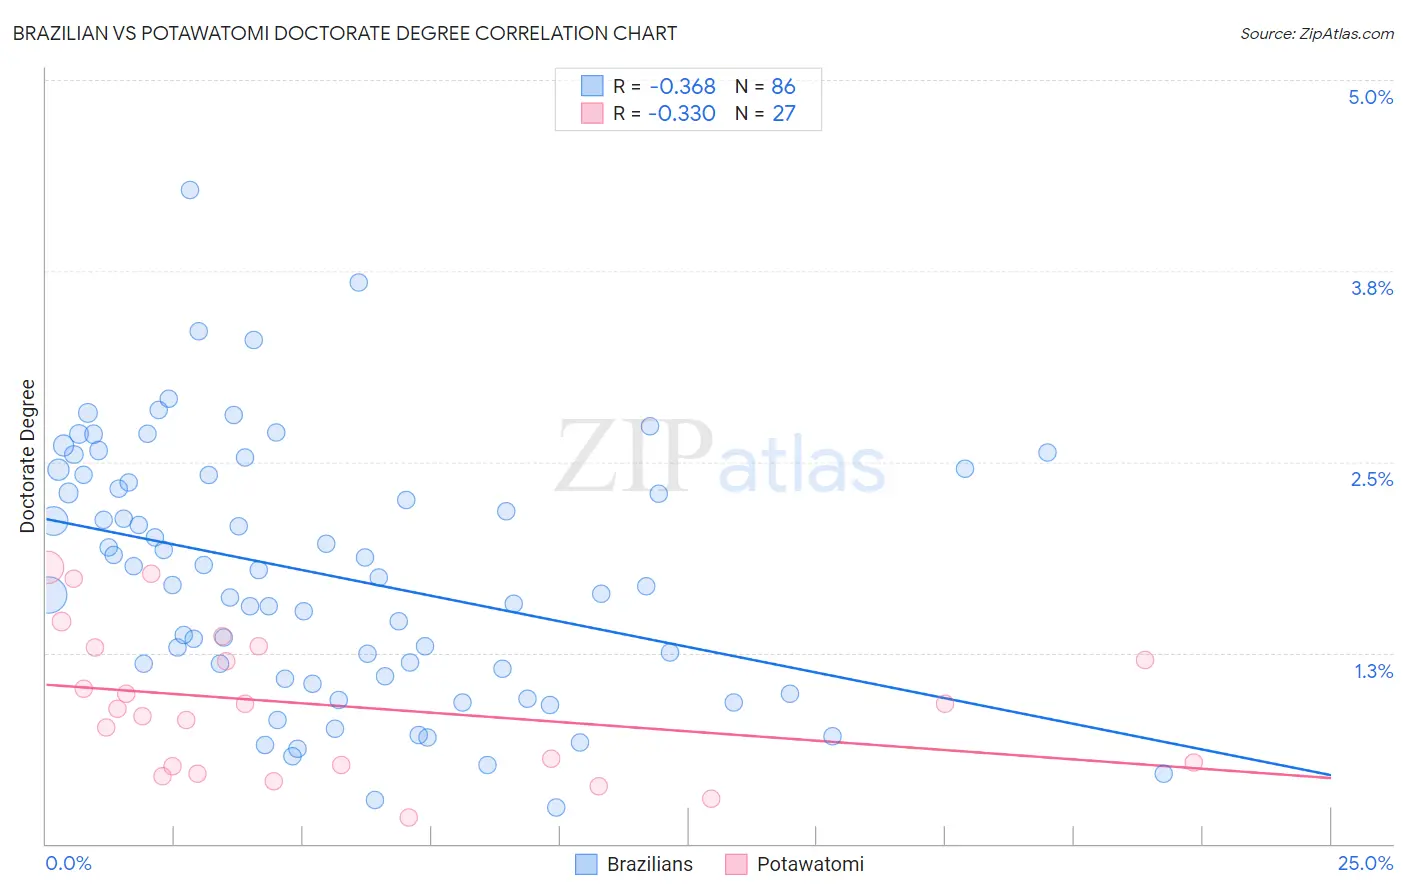
Brazilian vs Potawatomi Doctorate Degree Correlation Chart
The statistical analysis conducted on geographies consisting of 322,140,848 people shows a mild negative correlation between the proportion of Brazilians and percentage of population with at least doctorate degree education in the United States with a correlation coefficient (R) of -0.368 and weighted average of 2.1%. Similarly, the statistical analysis conducted on geographies consisting of 116,746,073 people shows a mild negative correlation between the proportion of Potawatomi and percentage of population with at least doctorate degree education in the United States with a correlation coefficient (R) of -0.330 and weighted average of 1.6%, a difference of 33.1%.
Doctorate Degree Correlation Summary
| Measurement | Brazilian | Potawatomi |
| Minimum | 0.24% | 0.18% |
| Maximum | 4.3% | 1.8% |
| Range | 4.0% | 1.6% |
| Mean | 1.8% | 0.91% |
| Median | 1.7% | 0.88% |
| Interquartile 25% (IQ1) | 1.1% | 0.51% |
| Interquartile 75% (IQ3) | 2.4% | 1.3% |
| Interquartile Range (IQR) | 1.3% | 0.78% |
| Standard Deviation (Sample) | 0.83% | 0.47% |
| Standard Deviation (Population) | 0.82% | 0.46% |
Similar Demographics by Doctorate Degree
Demographics Similar to Brazilians by Doctorate Degree
In terms of doctorate degree, the demographic groups most similar to Brazilians are Immigrants from Pakistan (2.1%, a difference of 0.060%), Ukrainian (2.1%, a difference of 0.070%), Syrian (2.1%, a difference of 0.080%), Immigrants from Germany (2.1%, a difference of 0.13%), and Immigrants from Italy (2.1%, a difference of 0.29%).
| Demographics | Rating | Rank | Doctorate Degree |
| Romanians | 98.1 /100 | #103 | Exceptional 2.1% |
| Austrians | 98.0 /100 | #104 | Exceptional 2.1% |
| Arabs | 97.8 /100 | #105 | Exceptional 2.1% |
| Sudanese | 97.7 /100 | #106 | Exceptional 2.1% |
| Europeans | 97.5 /100 | #107 | Exceptional 2.1% |
| Immigrants | Germany | 97.3 /100 | #108 | Exceptional 2.1% |
| Ukrainians | 97.2 /100 | #109 | Exceptional 2.1% |
| Brazilians | 97.2 /100 | #110 | Exceptional 2.1% |
| Immigrants | Pakistan | 97.1 /100 | #111 | Exceptional 2.1% |
| Syrians | 97.1 /100 | #112 | Exceptional 2.1% |
| Immigrants | Italy | 96.9 /100 | #113 | Exceptional 2.1% |
| Immigrants | Croatia | 96.8 /100 | #114 | Exceptional 2.1% |
| Taiwanese | 96.7 /100 | #115 | Exceptional 2.1% |
| Maltese | 96.2 /100 | #116 | Exceptional 2.1% |
| Lebanese | 96.0 /100 | #117 | Exceptional 2.1% |
Demographics Similar to Potawatomi by Doctorate Degree
In terms of doctorate degree, the demographic groups most similar to Potawatomi are Immigrants from Fiji (1.6%, a difference of 0.030%), African (1.6%, a difference of 0.47%), Comanche (1.6%, a difference of 0.59%), Hmong (1.6%, a difference of 0.61%), and Delaware (1.6%, a difference of 0.70%).
| Demographics | Rating | Rank | Doctorate Degree |
| Ottawa | 2.2 /100 | #242 | Tragic 1.6% |
| Native Hawaiians | 2.1 /100 | #243 | Tragic 1.6% |
| French American Indians | 2.0 /100 | #244 | Tragic 1.6% |
| Delaware | 1.9 /100 | #245 | Tragic 1.6% |
| Hmong | 1.8 /100 | #246 | Tragic 1.6% |
| Comanche | 1.8 /100 | #247 | Tragic 1.6% |
| Africans | 1.8 /100 | #248 | Tragic 1.6% |
| Potawatomi | 1.6 /100 | #249 | Tragic 1.6% |
| Immigrants | Fiji | 1.6 /100 | #250 | Tragic 1.6% |
| Apache | 1.3 /100 | #251 | Tragic 1.5% |
| Yuman | 1.1 /100 | #252 | Tragic 1.5% |
| Americans | 1.0 /100 | #253 | Tragic 1.5% |
| Immigrants | Cambodia | 1.0 /100 | #254 | Tragic 1.5% |
| Trinidadians and Tobagonians | 1.0 /100 | #255 | Tragic 1.5% |
| Central American Indians | 1.0 /100 | #256 | Tragic 1.5% |