Immigrants from St. Vincent and the Grenadines vs South African Doctorate Degree
COMPARE
Immigrants from St. Vincent and the Grenadines
South African
Doctorate Degree
Doctorate Degree Comparison
Immigrants from St. Vincent and the Grenadines
South Africans
1.3%
DOCTORATE DEGREE
0.1/ 100
METRIC RATING
320th/ 347
METRIC RANK
2.3%
DOCTORATE DEGREE
99.9/ 100
METRIC RATING
59th/ 347
METRIC RANK
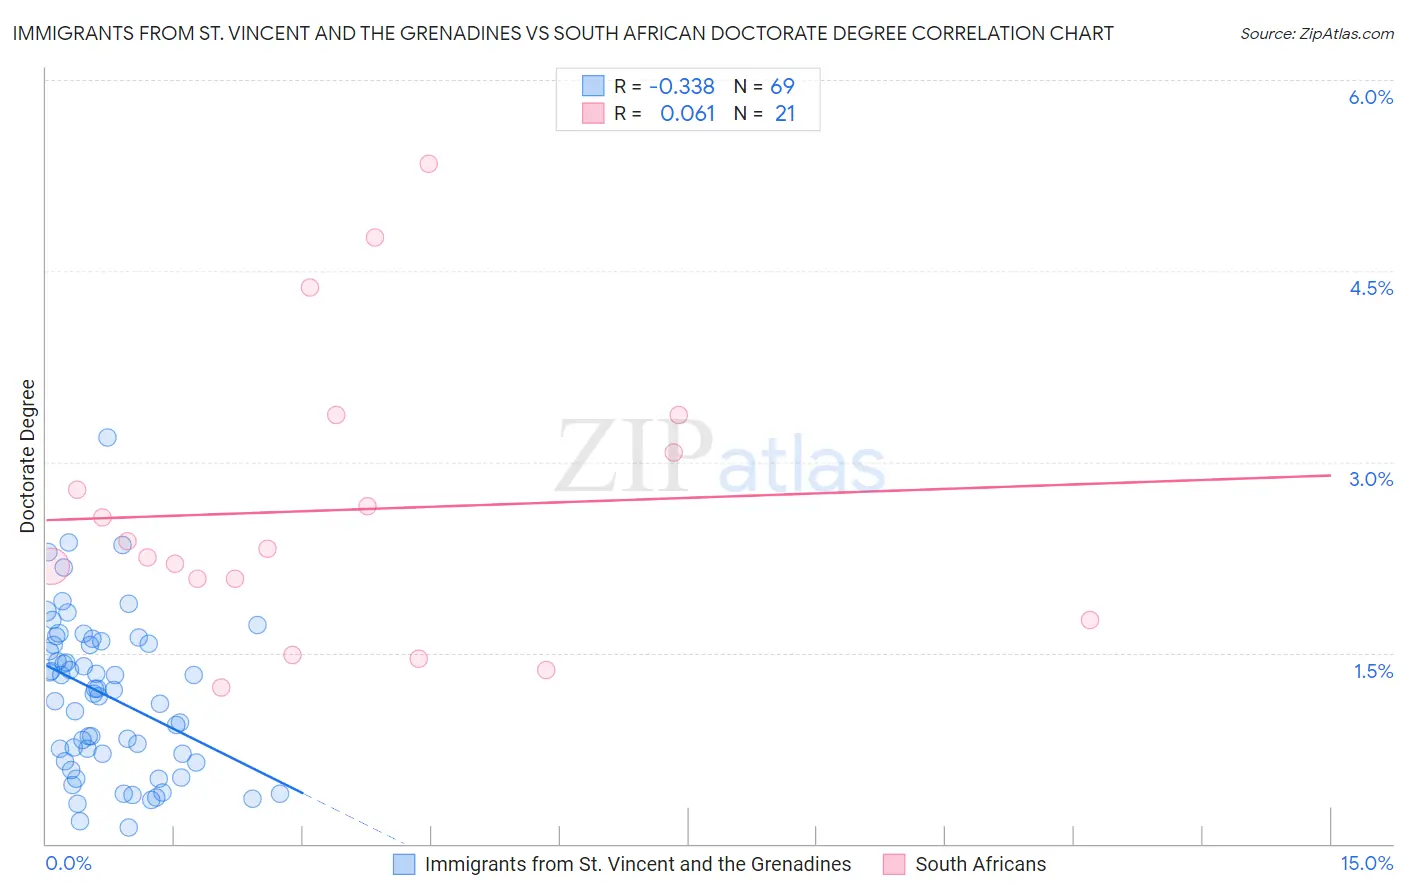
Immigrants from St. Vincent and the Grenadines vs South African Doctorate Degree Correlation Chart
The statistical analysis conducted on geographies consisting of 56,078,344 people shows a mild negative correlation between the proportion of Immigrants from St. Vincent and the Grenadines and percentage of population with at least doctorate degree education in the United States with a correlation coefficient (R) of -0.338 and weighted average of 1.3%. Similarly, the statistical analysis conducted on geographies consisting of 182,049,021 people shows a slight positive correlation between the proportion of South Africans and percentage of population with at least doctorate degree education in the United States with a correlation coefficient (R) of 0.061 and weighted average of 2.3%, a difference of 75.5%.
Doctorate Degree Correlation Summary
| Measurement | Immigrants from St. Vincent and the Grenadines | South African |
| Minimum | 0.13% | 1.2% |
| Maximum | 3.2% | 5.3% |
| Range | 3.1% | 4.1% |
| Mean | 1.2% | 2.6% |
| Median | 1.2% | 2.3% |
| Interquartile 25% (IQ1) | 0.68% | 1.9% |
| Interquartile 75% (IQ3) | 1.6% | 3.2% |
| Interquartile Range (IQR) | 0.90% | 1.3% |
| Standard Deviation (Sample) | 0.61% | 1.1% |
| Standard Deviation (Population) | 0.61% | 1.1% |
Similar Demographics by Doctorate Degree
Demographics Similar to Immigrants from St. Vincent and the Grenadines by Doctorate Degree
In terms of doctorate degree, the demographic groups most similar to Immigrants from St. Vincent and the Grenadines are Immigrants from Guyana (1.3%, a difference of 0.060%), Dutch West Indian (1.3%, a difference of 0.11%), Seminole (1.3%, a difference of 0.16%), Immigrants from Belize (1.3%, a difference of 0.36%), and Native/Alaskan (1.3%, a difference of 0.69%).
| Demographics | Rating | Rank | Doctorate Degree |
| Menominee | 0.1 /100 | #313 | Tragic 1.4% |
| Dominicans | 0.1 /100 | #314 | Tragic 1.4% |
| Immigrants | Azores | 0.1 /100 | #315 | Tragic 1.4% |
| Navajo | 0.1 /100 | #316 | Tragic 1.4% |
| Immigrants | Micronesia | 0.1 /100 | #317 | Tragic 1.3% |
| Creek | 0.1 /100 | #318 | Tragic 1.3% |
| Immigrants | Guyana | 0.1 /100 | #319 | Tragic 1.3% |
| Immigrants | St. Vincent and the Grenadines | 0.1 /100 | #320 | Tragic 1.3% |
| Dutch West Indians | 0.1 /100 | #321 | Tragic 1.3% |
| Seminole | 0.1 /100 | #322 | Tragic 1.3% |
| Immigrants | Belize | 0.1 /100 | #323 | Tragic 1.3% |
| Natives/Alaskans | 0.0 /100 | #324 | Tragic 1.3% |
| Pima | 0.0 /100 | #325 | Tragic 1.3% |
| Immigrants | Cabo Verde | 0.0 /100 | #326 | Tragic 1.3% |
| Hispanics or Latinos | 0.0 /100 | #327 | Tragic 1.3% |
Demographics Similar to South Africans by Doctorate Degree
In terms of doctorate degree, the demographic groups most similar to South Africans are Immigrants from Serbia (2.3%, a difference of 0.020%), Ethiopian (2.3%, a difference of 0.44%), Immigrants from Ethiopia (2.4%, a difference of 0.56%), Bhutanese (2.3%, a difference of 0.79%), and Immigrants from Czechoslovakia (2.4%, a difference of 1.0%).
| Demographics | Rating | Rank | Doctorate Degree |
| Bulgarians | 100.0 /100 | #52 | Exceptional 2.4% |
| Immigrants | Latvia | 100.0 /100 | #53 | Exceptional 2.4% |
| Immigrants | Indonesia | 100.0 /100 | #54 | Exceptional 2.4% |
| Bolivians | 100.0 /100 | #55 | Exceptional 2.4% |
| Immigrants | Czechoslovakia | 100.0 /100 | #56 | Exceptional 2.4% |
| Immigrants | Ethiopia | 100.0 /100 | #57 | Exceptional 2.4% |
| Ethiopians | 99.9 /100 | #58 | Exceptional 2.3% |
| South Africans | 99.9 /100 | #59 | Exceptional 2.3% |
| Immigrants | Serbia | 99.9 /100 | #60 | Exceptional 2.3% |
| Bhutanese | 99.9 /100 | #61 | Exceptional 2.3% |
| Immigrants | Europe | 99.9 /100 | #62 | Exceptional 2.3% |
| Laotians | 99.9 /100 | #63 | Exceptional 2.3% |
| Immigrants | Greece | 99.9 /100 | #64 | Exceptional 2.3% |
| Paraguayans | 99.9 /100 | #65 | Exceptional 2.3% |
| Argentineans | 99.9 /100 | #66 | Exceptional 2.3% |