Brazilian vs Guatemalan Doctorate Degree
COMPARE
Brazilian
Guatemalan
Doctorate Degree
Doctorate Degree Comparison
Brazilians
Guatemalans
2.1%
DOCTORATE DEGREE
97.2/ 100
METRIC RATING
110th/ 347
METRIC RANK
1.4%
DOCTORATE DEGREE
0.2/ 100
METRIC RATING
295th/ 347
METRIC RANK
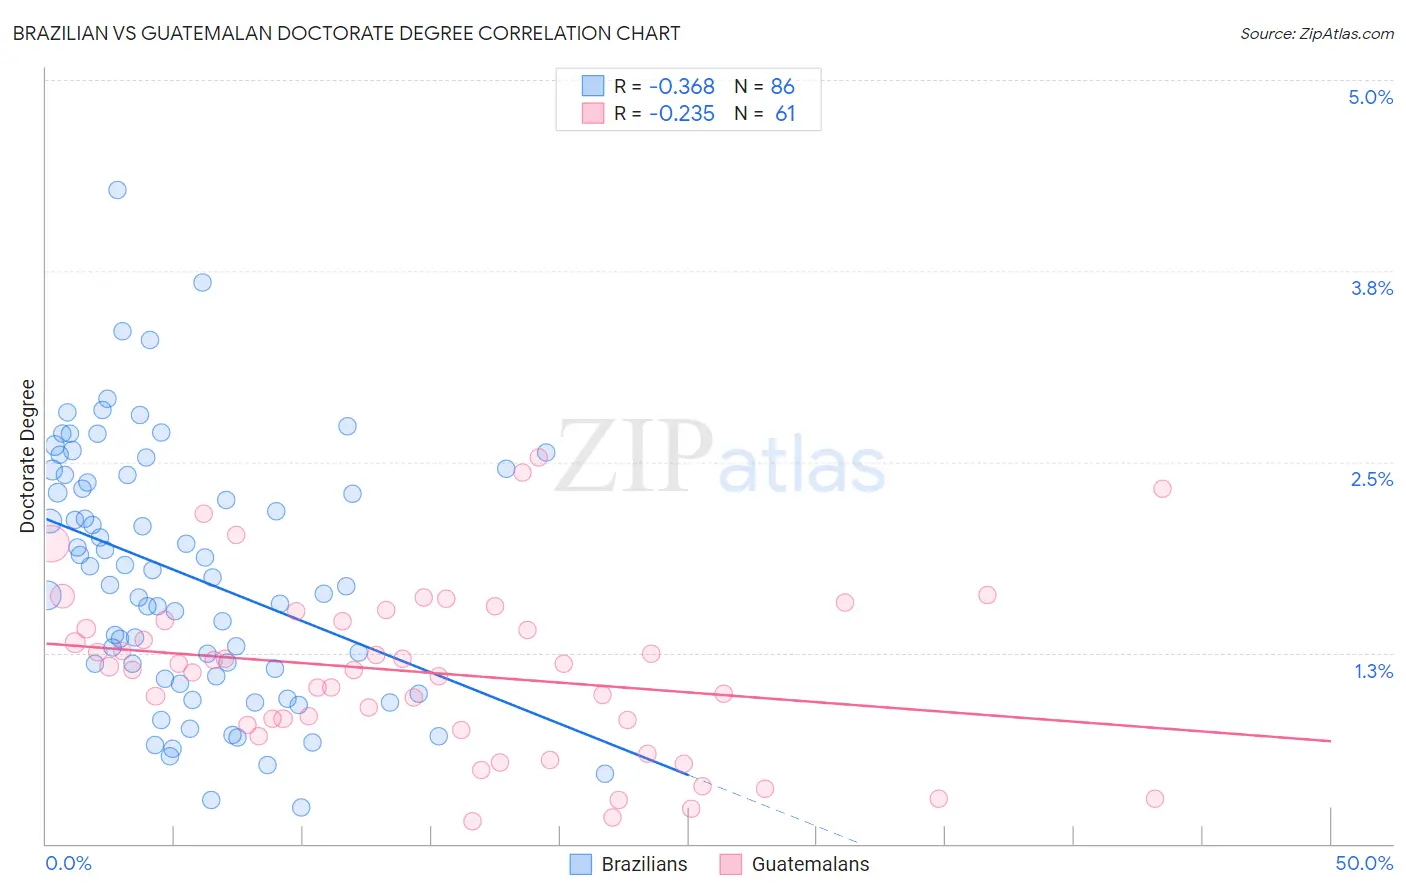
Brazilian vs Guatemalan Doctorate Degree Correlation Chart
The statistical analysis conducted on geographies consisting of 322,140,848 people shows a mild negative correlation between the proportion of Brazilians and percentage of population with at least doctorate degree education in the United States with a correlation coefficient (R) of -0.368 and weighted average of 2.1%. Similarly, the statistical analysis conducted on geographies consisting of 404,030,982 people shows a weak negative correlation between the proportion of Guatemalans and percentage of population with at least doctorate degree education in the United States with a correlation coefficient (R) of -0.235 and weighted average of 1.4%, a difference of 47.1%.
Doctorate Degree Correlation Summary
| Measurement | Brazilian | Guatemalan |
| Minimum | 0.24% | 0.15% |
| Maximum | 4.3% | 2.5% |
| Range | 4.0% | 2.4% |
| Mean | 1.8% | 1.1% |
| Median | 1.7% | 1.1% |
| Interquartile 25% (IQ1) | 1.1% | 0.76% |
| Interquartile 75% (IQ3) | 2.4% | 1.5% |
| Interquartile Range (IQR) | 1.3% | 0.70% |
| Standard Deviation (Sample) | 0.83% | 0.56% |
| Standard Deviation (Population) | 0.82% | 0.55% |
Similar Demographics by Doctorate Degree
Demographics Similar to Brazilians by Doctorate Degree
In terms of doctorate degree, the demographic groups most similar to Brazilians are Immigrants from Pakistan (2.1%, a difference of 0.060%), Ukrainian (2.1%, a difference of 0.070%), Syrian (2.1%, a difference of 0.080%), Immigrants from Germany (2.1%, a difference of 0.13%), and Immigrants from Italy (2.1%, a difference of 0.29%).
| Demographics | Rating | Rank | Doctorate Degree |
| Romanians | 98.1 /100 | #103 | Exceptional 2.1% |
| Austrians | 98.0 /100 | #104 | Exceptional 2.1% |
| Arabs | 97.8 /100 | #105 | Exceptional 2.1% |
| Sudanese | 97.7 /100 | #106 | Exceptional 2.1% |
| Europeans | 97.5 /100 | #107 | Exceptional 2.1% |
| Immigrants | Germany | 97.3 /100 | #108 | Exceptional 2.1% |
| Ukrainians | 97.2 /100 | #109 | Exceptional 2.1% |
| Brazilians | 97.2 /100 | #110 | Exceptional 2.1% |
| Immigrants | Pakistan | 97.1 /100 | #111 | Exceptional 2.1% |
| Syrians | 97.1 /100 | #112 | Exceptional 2.1% |
| Immigrants | Italy | 96.9 /100 | #113 | Exceptional 2.1% |
| Immigrants | Croatia | 96.8 /100 | #114 | Exceptional 2.1% |
| Taiwanese | 96.7 /100 | #115 | Exceptional 2.1% |
| Maltese | 96.2 /100 | #116 | Exceptional 2.1% |
| Lebanese | 96.0 /100 | #117 | Exceptional 2.1% |
Demographics Similar to Guatemalans by Doctorate Degree
In terms of doctorate degree, the demographic groups most similar to Guatemalans are Immigrants from Ecuador (1.4%, a difference of 0.23%), Tsimshian (1.4%, a difference of 0.45%), Samoan (1.4%, a difference of 0.70%), Puerto Rican (1.4%, a difference of 0.86%), and Belizean (1.4%, a difference of 1.3%).
| Demographics | Rating | Rank | Doctorate Degree |
| Immigrants | El Salvador | 0.3 /100 | #288 | Tragic 1.4% |
| Cape Verdeans | 0.3 /100 | #289 | Tragic 1.4% |
| Choctaw | 0.3 /100 | #290 | Tragic 1.4% |
| Blacks/African Americans | 0.3 /100 | #291 | Tragic 1.4% |
| Alaska Natives | 0.3 /100 | #292 | Tragic 1.4% |
| Immigrants | Yemen | 0.2 /100 | #293 | Tragic 1.4% |
| Samoans | 0.2 /100 | #294 | Tragic 1.4% |
| Guatemalans | 0.2 /100 | #295 | Tragic 1.4% |
| Immigrants | Ecuador | 0.2 /100 | #296 | Tragic 1.4% |
| Tsimshian | 0.2 /100 | #297 | Tragic 1.4% |
| Puerto Ricans | 0.1 /100 | #298 | Tragic 1.4% |
| Belizeans | 0.1 /100 | #299 | Tragic 1.4% |
| Immigrants | Guatemala | 0.1 /100 | #300 | Tragic 1.4% |
| Hondurans | 0.1 /100 | #301 | Tragic 1.4% |
| Shoshone | 0.1 /100 | #302 | Tragic 1.4% |