Brazilian vs Immigrants from Portugal Doctorate Degree

COMPARE

Brazilian
Race
Ancestry
AfghanAfricanAlaska NativeAlaskan AthabascanAlbanianAleutAlsatianAmericanApacheArabArapahoArgentineanArmenianAssyrian/Chaldean/SyriacAustralianAustrianBahamianBangladeshiBarbadianBasqueBelgianBelizeanBermudanBhutaneseBlackfeetBolivianBrazilianBritishBritish West IndianBulgarianBurmeseCajunCambodianCanadianCape VerdeanCarpatho RusynCelticCentral AmericanCentral American IndianCherokeeCheyenneChickasawChileanChineseChippewaChoctawColombianColvilleComancheCosta RicanCreeCreekCroatianCrowCubanCypriotCzechCzechoslovakianDanishDelawareDominicanDutchDutch West IndianEastern EuropeanEcuadorianEgyptianEnglishEstonianEthiopianEuropeanFijianFilipinoFinnishFrenchFrench American IndianFrench CanadianGermanGerman RussianGhanaianGreekGuamanian/ChamorroGuatemalanGuyaneseHaitianHmongHonduranHopiHoumaHungarianIcelanderIndian (Asian)IndonesianInupiatIranianIraqiIrishIroquoisIsraeliItalianJamaicanJapaneseJordanianKenyanKiowaKoreanLaotianLatvianLebaneseLiberianLithuanianLumbeeLuxembourgerMacedonianMalaysianMalteseMarshalleseMenomineeMexicanMexican American IndianMongolianMoroccanNative HawaiianNavajoNepaleseNew ZealanderNicaraguanNigerianNorthern EuropeanNorwegianOkinawanOsageOttawaPaiutePakistaniPalestinianPanamanianParaguayanPennsylvania GermanPeruvianPimaPolishPortuguesePotawatomiPuebloPuerto RicanPuget Sound SalishRomanianRussianSalvadoranSamoanScandinavianScotch-IrishScottishSeminoleSenegaleseSerbianShoshoneSierra LeoneanSiouxSlavicSlovakSloveneSomaliSouth AfricanSouth AmericanSouth American IndianSoviet UnionSpaniardSpanishSpanish AmericanSpanish American IndianSri LankanSubsaharan AfricanSudaneseSwedishSwissSyrianTaiwaneseThaiTlingit-HaidaTohono O'OdhamTonganTrinidadian and TobagonianTsimshianTurkishU.S. Virgin IslanderUgandanUkrainianUruguayanUteVenezuelanVietnameseWelshWest IndianYakamaYaquiYugoslavianYumanYup'ikZimbabwean
Immigration
NonimmigrantsImmigrantsAfghanistanAfricaAlbaniaArgentinaArmeniaAsiaAustraliaAustriaBahamasBangladeshBarbadosBelarusBelgiumBelizeBoliviaBosnia and HerzegovinaBrazilBulgariaBurma/MyanmarCabo VerdeCambodiaCameroonCanadaCaribbeanCentral AmericaChileChinaColombiaCongoCosta RicaCroatiaCubaCzechoslovakiaDenmarkDominicaDominican RepublicEastern AfricaEastern AsiaEastern EuropeEcuadorEgyptEl SalvadorEnglandEritreaEthiopiaEuropeFijiFranceGermanyGhanaGreeceGrenadaGuatemalaGuyanaHaitiHondurasHong KongHungaryIndiaIndonesiaIranIraqIrelandIsraelItalyJamaicaJapanJordanKazakhstanKenyaKoreaKuwaitLaosLatin AmericaLatviaLebanonLiberiaLithuaniaMalaysiaMexicoMicronesiaMiddle AfricaMoldovaMoroccoNepalNetherlandsNicaraguaNigeriaNorth AmericaNorth MacedoniaNorthern AfricaNorthern EuropeNorwayOceaniaPakistanPanamaPeruPhilippinesPolandRomaniaRussiaSaudi ArabiaScotlandSenegalSerbiaSierra LeoneSingaporeSomaliaSouth AfricaSouth AmericaSouth Central AsiaSouth Eastern AsiaSouthern EuropeSpainSri LankaSt. Vincent and the GrenadinesSudanSwedenSwitzerlandSyriaTaiwanThailandTrinidad and TobagoTurkeyUgandaUkraineUruguayUzbekistanVenezuelaVietnamWest IndiesWestern AfricaWestern AsiaWestern EuropeYemenZaireZimbabweAzores
Immigrants from Portugal
Race
Ancestry
AfghanAfricanAlaska NativeAlaskan AthabascanAlbanianAleutAlsatianAmericanApacheArabArapahoArgentineanArmenianAssyrian/Chaldean/SyriacAustralianAustrianBahamianBangladeshiBarbadianBasqueBelgianBelizeanBermudanBhutaneseBlackfeetBolivianBritishBritish West IndianBulgarianBurmeseCajunCambodianCanadianCape VerdeanCarpatho RusynCelticCentral AmericanCentral American IndianCherokeeCheyenneChickasawChileanChineseChippewaChoctawColombianColvilleComancheCosta RicanCreeCreekCroatianCrowCubanCypriotCzechCzechoslovakianDanishDelawareDominicanDutchDutch West IndianEastern EuropeanEcuadorianEgyptianEnglishEstonianEthiopianEuropeanFijianFilipinoFinnishFrenchFrench American IndianFrench CanadianGermanGerman RussianGhanaianGreekGuamanian/ChamorroGuatemalanGuyaneseHaitianHmongHonduranHopiHoumaHungarianIcelanderIndian (Asian)IndonesianInupiatIranianIraqiIrishIroquoisIsraeliItalianJamaicanJapaneseJordanianKenyanKiowaKoreanLaotianLatvianLebaneseLiberianLithuanianLumbeeLuxembourgerMacedonianMalaysianMalteseMarshalleseMenomineeMexicanMexican American IndianMongolianMoroccanNative HawaiianNavajoNepaleseNew ZealanderNicaraguanNigerianNorthern EuropeanNorwegianOkinawanOsageOttawaPaiutePakistaniPalestinianPanamanianParaguayanPennsylvania GermanPeruvianPimaPolishPortuguesePotawatomiPuebloPuerto RicanPuget Sound SalishRomanianRussianSalvadoranSamoanScandinavianScotch-IrishScottishSeminoleSenegaleseSerbianShoshoneSierra LeoneanSiouxSlavicSlovakSloveneSomaliSouth AfricanSouth AmericanSouth American IndianSoviet UnionSpaniardSpanishSpanish AmericanSpanish American IndianSri LankanSubsaharan AfricanSudaneseSwedishSwissSyrianTaiwaneseThaiTlingit-HaidaTohono O'OdhamTonganTrinidadian and TobagonianTsimshianTurkishU.S. Virgin IslanderUgandanUkrainianUruguayanUteVenezuelanVietnameseWelshWest IndianYakamaYaquiYugoslavianYumanYup'ikZimbabwean
Immigration
NonimmigrantsImmigrantsAfghanistanAfricaAlbaniaArgentinaArmeniaAsiaAustraliaAustriaBahamasBangladeshBarbadosBelarusBelgiumBelizeBoliviaBosnia and HerzegovinaBrazilBulgariaBurma/MyanmarCabo VerdeCambodiaCameroonCanadaCaribbeanCentral AmericaChileChinaColombiaCongoCosta RicaCroatiaCubaCzechoslovakiaDenmarkDominicaDominican RepublicEastern AfricaEastern AsiaEastern EuropeEcuadorEgyptEl SalvadorEnglandEritreaEthiopiaEuropeFijiFranceGermanyGhanaGreeceGrenadaGuatemalaGuyanaHaitiHondurasHong KongHungaryIndiaIndonesiaIranIraqIrelandIsraelItalyJamaicaJapanJordanKazakhstanKenyaKoreaKuwaitLaosLatin AmericaLatviaLebanonLiberiaLithuaniaMalaysiaMexicoMicronesiaMiddle AfricaMoldovaMoroccoNepalNetherlandsNicaraguaNigeriaNorth AmericaNorth MacedoniaNorthern AfricaNorthern EuropeNorwayOceaniaPakistanPanamaPeruPhilippinesPolandPortugalRomaniaRussiaSaudi ArabiaScotlandSenegalSerbiaSierra LeoneSingaporeSomaliaSouth AfricaSouth AmericaSouth Central AsiaSouth Eastern AsiaSouthern EuropeSpainSri LankaSt. Vincent and the GrenadinesSudanSwedenSwitzerlandSyriaTaiwanThailandTrinidad and TobagoTurkeyUgandaUkraineUruguayUzbekistanVenezuelaVietnamWest IndiesWestern AfricaWestern AsiaWestern EuropeYemenZaireZimbabweAzores
Doctorate Degree
Income
Poverty
Unemployment
Labor Participation
Family Structure
Vehicle Availability
Education Level
Disability

Doctorate Degree Comparison

Brazilians

Immigrants from Portugal

Exceptional
Tragic
2.1%
DOCTORATE DEGREE
97.2/ 100
METRIC RATING
110th/ 347
METRIC RANK
1.5%
DOCTORATE DEGREE
0.8/ 100
METRIC RATING
261st/ 347
METRIC RANK

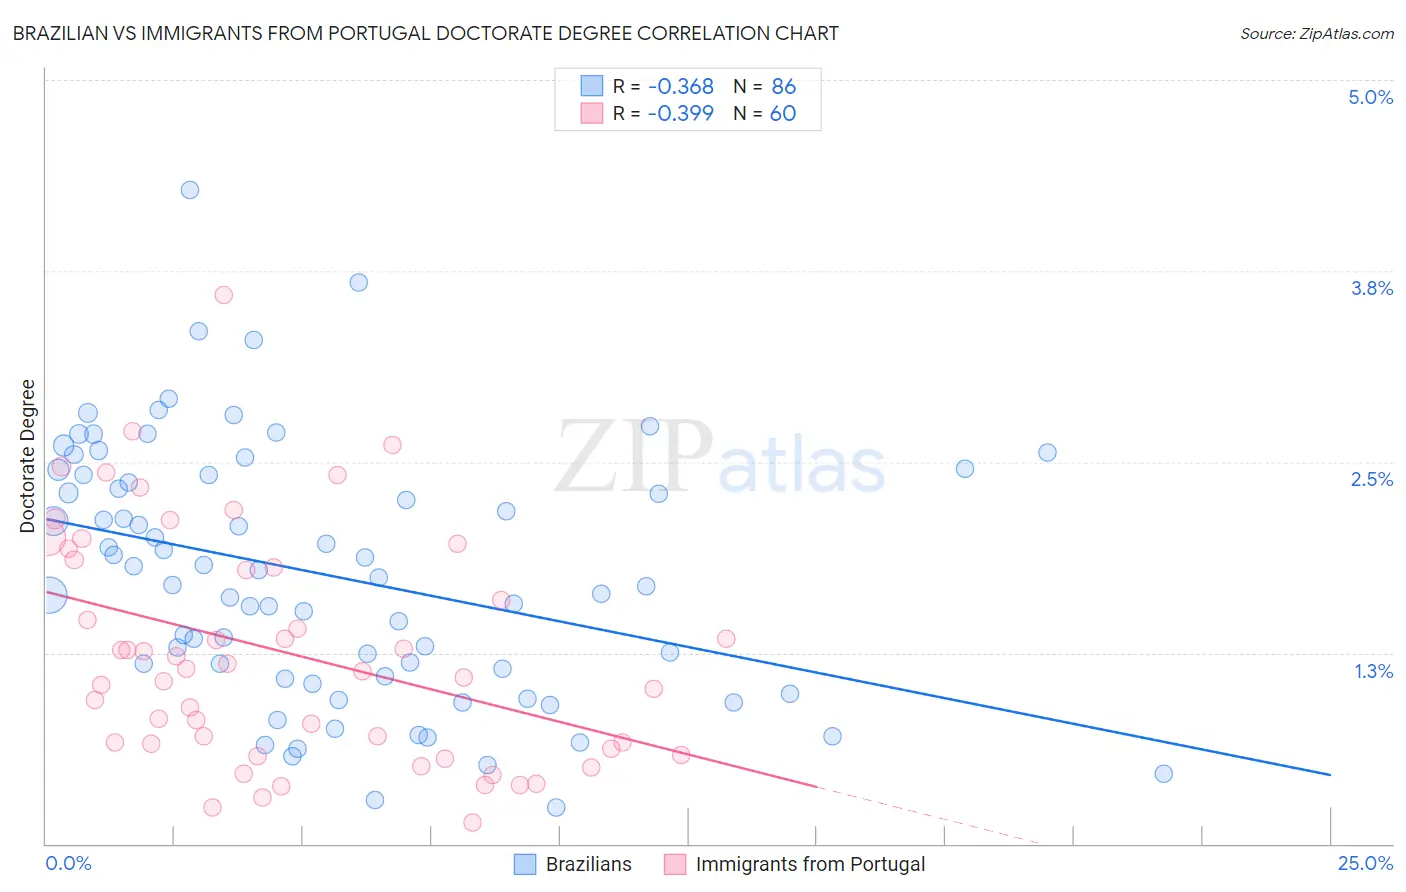
Brazilian vs Immigrants from Portugal Doctorate Degree Correlation Chart

The statistical analysis conducted on geographies consisting of 322,140,848 people shows a mild negative correlation between the proportion of Brazilians and percentage of population with at least doctorate degree education in the United States with a correlation coefficient (R) of -0.368 and weighted average of 2.1%. Similarly, the statistical analysis conducted on geographies consisting of 173,995,851 people shows a mild negative correlation between the proportion of Immigrants from Portugal and percentage of population with at least doctorate degree education in the United States with a correlation coefficient (R) of -0.399 and weighted average of 1.5%, a difference of 37.4%.
Brazilian vs Immigrants from Portugal Doctorate Degree

Doctorate Degree Correlation Summary

MeasurementBrazilianImmigrants from Portugal
Minimum0.24%0.14%
Maximum4.3%3.6%
Range4.0%3.5%
Mean1.8%1.2%
Median1.7%1.1%
Interquartile 25% (IQ1)1.1%0.64%
Interquartile 75% (IQ3)2.4%1.8%
Interquartile Range (IQR)1.3%1.2%
Standard Deviation (Sample)0.83%0.75%
Standard Deviation (Population)0.82%0.75%

Similar Demographics by Doctorate Degree

Demographics Similar to Brazilians by Doctorate Degree

In terms of doctorate degree, the demographic groups most similar to Brazilians are Immigrants from Pakistan (2.1%, a difference of 0.060%), Ukrainian (2.1%, a difference of 0.070%), Syrian (2.1%, a difference of 0.080%), Immigrants from Germany (2.1%, a difference of 0.13%), and Immigrants from Italy (2.1%, a difference of 0.29%).
DemographicsRating | RankDoctorate Degree
Romanians
98.1
/100
|
#103
Exceptional
2.1%
Austrians
98.0
/100
|
#104
Exceptional
2.1%
Arabs
97.8
/100
|
#105
Exceptional
2.1%
Sudanese
97.7
/100
|
#106
Exceptional
2.1%
Europeans
97.5
/100
|
#107
Exceptional
2.1%
Immigrants | Germany
97.3
/100
|
#108
Exceptional
2.1%
Ukrainians
97.2
/100
|
#109
Exceptional
2.1%
Brazilians
97.2
/100
|
#110
Exceptional
2.1%
Immigrants | Pakistan
97.1
/100
|
#111
Exceptional
2.1%
Syrians
97.1
/100
|
#112
Exceptional
2.1%
Immigrants | Italy
96.9
/100
|
#113
Exceptional
2.1%
Immigrants | Croatia
96.8
/100
|
#114
Exceptional
2.1%
Taiwanese
96.7
/100
|
#115
Exceptional
2.1%
Maltese
96.2
/100
|
#116
Exceptional
2.1%
Lebanese
96.0
/100
|
#117
Exceptional
2.1%

Demographics Similar to Immigrants from Portugal by Doctorate Degree

In terms of doctorate degree, the demographic groups most similar to Immigrants from Portugal are Chickasaw (1.5%, a difference of 0.15%), Immigrants from Bahamas (1.5%, a difference of 0.32%), Japanese (1.5%, a difference of 0.46%), Blackfeet (1.5%, a difference of 0.51%), and Liberian (1.5%, a difference of 0.56%).
DemographicsRating | RankDoctorate Degree
Immigrants | Cambodia
1.0
/100
|
#254
Tragic
1.5%
Trinidadians and Tobagonians
1.0
/100
|
#255
Tragic
1.5%
Central American Indians
1.0
/100
|
#256
Tragic
1.5%
Chippewa
0.9
/100
|
#257
Tragic
1.5%
Immigrants | West Indies
0.9
/100
|
#258
Tragic
1.5%
Liberians
0.9
/100
|
#259
Tragic
1.5%
Japanese
0.9
/100
|
#260
Tragic
1.5%
Immigrants | Portugal
0.8
/100
|
#261
Tragic
1.5%
Chickasaw
0.7
/100
|
#262
Tragic
1.5%
Immigrants | Bahamas
0.7
/100
|
#263
Tragic
1.5%
Blackfeet
0.7
/100
|
#264
Tragic
1.5%
Nicaraguans
0.6
/100
|
#265
Tragic
1.5%
Immigrants | Liberia
0.5
/100
|
#266
Tragic
1.5%
Kiowa
0.5
/100
|
#267
Tragic
1.5%
U.S. Virgin Islanders
0.5
/100
|
#268
Tragic
1.5%