French Canadian vs Immigrants from Nepal Doctorate Degree
COMPARE
French Canadian
Immigrants from Nepal
Doctorate Degree
Doctorate Degree Comparison
French Canadians
Immigrants from Nepal
1.8%
DOCTORATE DEGREE
30.2/ 100
METRIC RATING
189th/ 347
METRIC RANK
2.2%
DOCTORATE DEGREE
99.3/ 100
METRIC RATING
88th/ 347
METRIC RANK
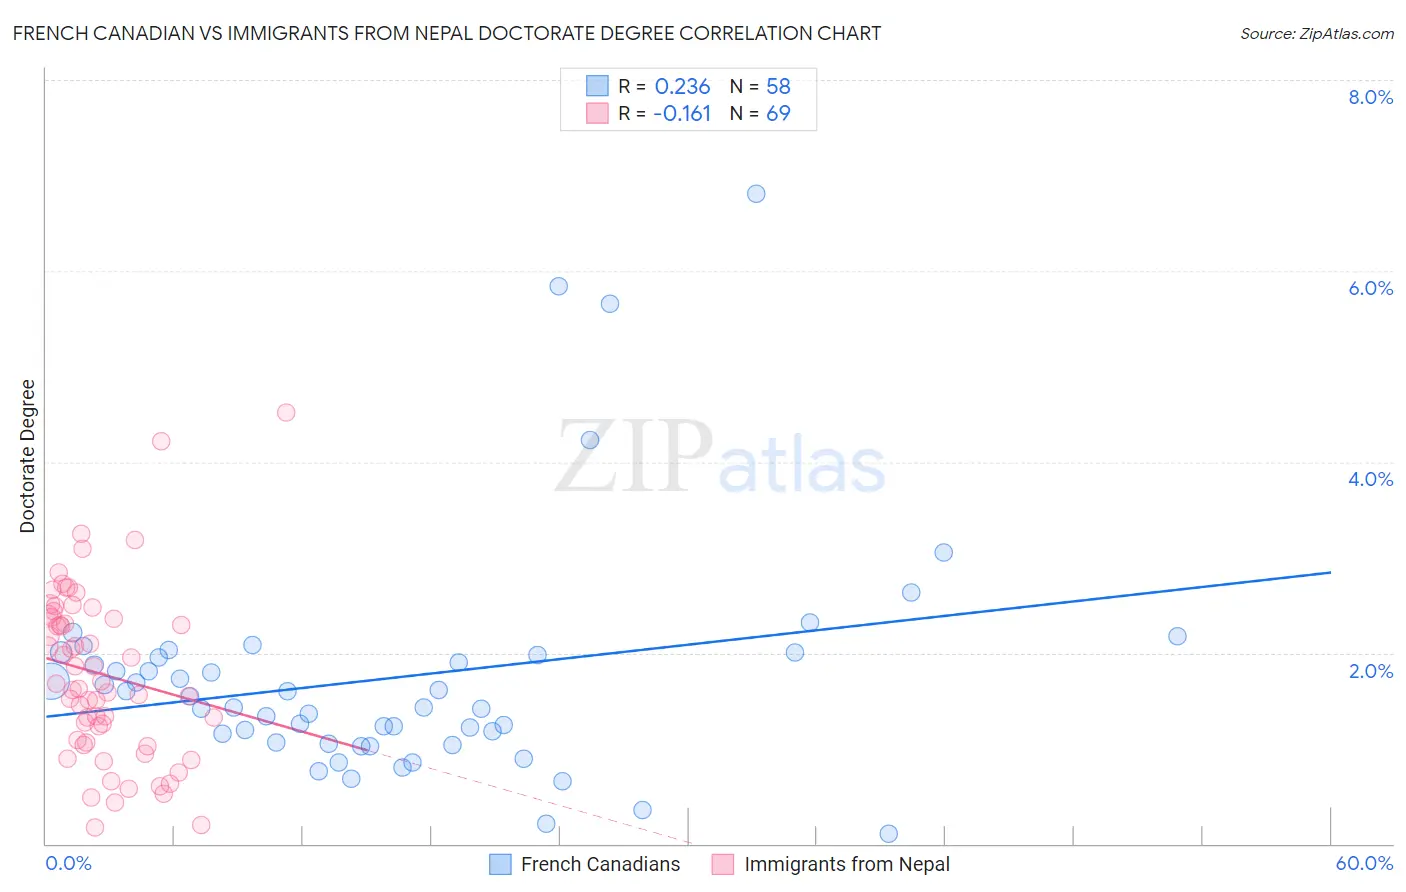
French Canadian vs Immigrants from Nepal Doctorate Degree Correlation Chart
The statistical analysis conducted on geographies consisting of 490,873,037 people shows a weak positive correlation between the proportion of French Canadians and percentage of population with at least doctorate degree education in the United States with a correlation coefficient (R) of 0.236 and weighted average of 1.8%. Similarly, the statistical analysis conducted on geographies consisting of 186,268,809 people shows a poor negative correlation between the proportion of Immigrants from Nepal and percentage of population with at least doctorate degree education in the United States with a correlation coefficient (R) of -0.161 and weighted average of 2.2%, a difference of 22.2%.
Doctorate Degree Correlation Summary
| Measurement | French Canadian | Immigrants from Nepal |
| Minimum | 0.11% | 0.17% |
| Maximum | 6.8% | 4.5% |
| Range | 6.7% | 4.3% |
| Mean | 1.7% | 1.8% |
| Median | 1.5% | 1.7% |
| Interquartile 25% (IQ1) | 1.1% | 1.1% |
| Interquartile 75% (IQ3) | 2.0% | 2.4% |
| Interquartile Range (IQR) | 0.92% | 1.3% |
| Standard Deviation (Sample) | 1.2% | 0.89% |
| Standard Deviation (Population) | 1.2% | 0.88% |
Similar Demographics by Doctorate Degree
Demographics Similar to French Canadians by Doctorate Degree
In terms of doctorate degree, the demographic groups most similar to French Canadians are Immigrants from Costa Rica (1.8%, a difference of 0.020%), German (1.8%, a difference of 0.040%), South American (1.8%, a difference of 0.13%), Czechoslovakian (1.8%, a difference of 0.49%), and Dutch (1.8%, a difference of 0.52%).
| Demographics | Rating | Rank | Doctorate Degree |
| Immigrants | Afghanistan | 44.3 /100 | #182 | Average 1.8% |
| Finns | 42.1 /100 | #183 | Average 1.8% |
| Nigerians | 39.9 /100 | #184 | Fair 1.8% |
| Slovaks | 36.4 /100 | #185 | Fair 1.8% |
| Peruvians | 34.4 /100 | #186 | Fair 1.8% |
| Czechoslovakians | 33.0 /100 | #187 | Fair 1.8% |
| Germans | 30.5 /100 | #188 | Fair 1.8% |
| French Canadians | 30.2 /100 | #189 | Fair 1.8% |
| Immigrants | Costa Rica | 30.2 /100 | #190 | Fair 1.8% |
| South Americans | 29.5 /100 | #191 | Fair 1.8% |
| Dutch | 27.4 /100 | #192 | Fair 1.8% |
| German Russians | 27.1 /100 | #193 | Fair 1.8% |
| Uruguayans | 26.2 /100 | #194 | Fair 1.8% |
| Immigrants | Somalia | 25.4 /100 | #195 | Fair 1.8% |
| Sub-Saharan Africans | 25.1 /100 | #196 | Fair 1.8% |
Demographics Similar to Immigrants from Nepal by Doctorate Degree
In terms of doctorate degree, the demographic groups most similar to Immigrants from Nepal are Immigrants from Zimbabwe (2.2%, a difference of 0.36%), British (2.2%, a difference of 0.44%), Immigrants from Scotland (2.2%, a difference of 0.45%), Egyptian (2.2%, a difference of 0.47%), and Immigrants from Sudan (2.2%, a difference of 0.93%).
| Demographics | Rating | Rank | Doctorate Degree |
| Immigrants | Argentina | 99.7 /100 | #81 | Exceptional 2.2% |
| Immigrants | Uganda | 99.6 /100 | #82 | Exceptional 2.2% |
| Immigrants | Lithuania | 99.6 /100 | #83 | Exceptional 2.2% |
| Immigrants | England | 99.6 /100 | #84 | Exceptional 2.2% |
| Immigrants | Brazil | 99.6 /100 | #85 | Exceptional 2.2% |
| Egyptians | 99.4 /100 | #86 | Exceptional 2.2% |
| Immigrants | Zimbabwe | 99.4 /100 | #87 | Exceptional 2.2% |
| Immigrants | Nepal | 99.3 /100 | #88 | Exceptional 2.2% |
| British | 99.3 /100 | #89 | Exceptional 2.2% |
| Immigrants | Scotland | 99.2 /100 | #90 | Exceptional 2.2% |
| Immigrants | Sudan | 99.1 /100 | #91 | Exceptional 2.2% |
| Chileans | 99.1 /100 | #92 | Exceptional 2.2% |
| Alsatians | 99.0 /100 | #93 | Exceptional 2.1% |
| Greeks | 98.8 /100 | #94 | Exceptional 2.1% |
| Immigrants | Romania | 98.7 /100 | #95 | Exceptional 2.1% |