Brazilian vs French Canadian No Schooling Completed
COMPARE
Brazilian
French Canadian
No Schooling Completed
No Schooling Completed Comparison
Brazilians
French Canadians
2.1%
NO SCHOOLING COMPLETED
60.2/ 100
METRIC RATING
165th/ 347
METRIC RANK
1.5%
NO SCHOOLING COMPLETED
100.0/ 100
METRIC RATING
28th/ 347
METRIC RANK
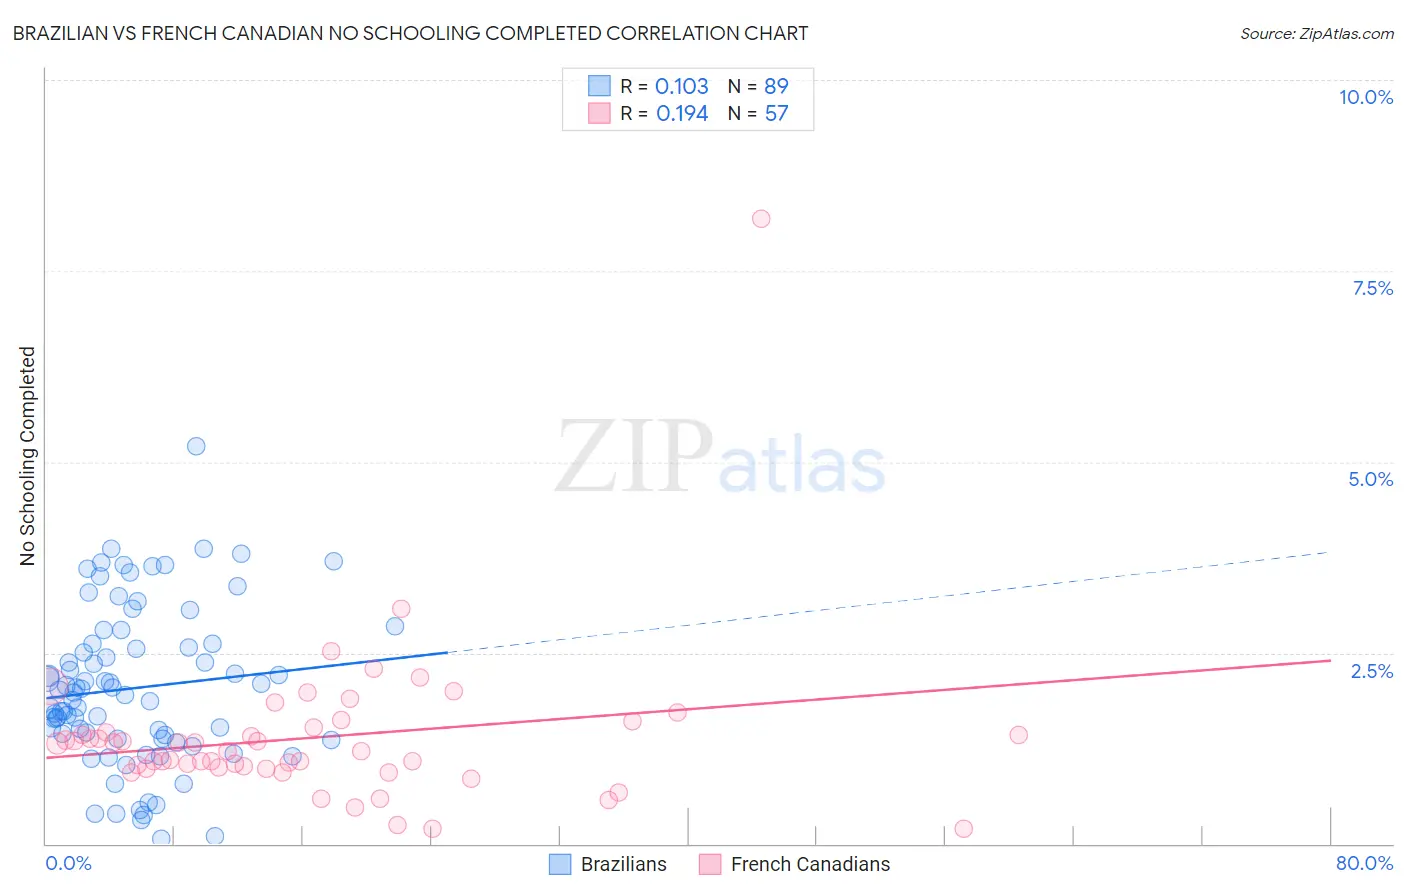
Brazilian vs French Canadian No Schooling Completed Correlation Chart
The statistical analysis conducted on geographies consisting of 321,239,467 people shows a poor positive correlation between the proportion of Brazilians and percentage of population with no schooling in the United States with a correlation coefficient (R) of 0.103 and weighted average of 2.1%. Similarly, the statistical analysis conducted on geographies consisting of 491,496,199 people shows a poor positive correlation between the proportion of French Canadians and percentage of population with no schooling in the United States with a correlation coefficient (R) of 0.194 and weighted average of 1.5%, a difference of 37.4%.
No Schooling Completed Correlation Summary
| Measurement | Brazilian | French Canadian |
| Minimum | 0.065% | 0.20% |
| Maximum | 5.2% | 8.2% |
| Range | 5.1% | 8.0% |
| Mean | 2.0% | 1.4% |
| Median | 2.0% | 1.2% |
| Interquartile 25% (IQ1) | 1.4% | 0.99% |
| Interquartile 75% (IQ3) | 2.6% | 1.5% |
| Interquartile Range (IQR) | 1.2% | 0.49% |
| Standard Deviation (Sample) | 1.0% | 1.1% |
| Standard Deviation (Population) | 1.0% | 1.1% |
Similar Demographics by No Schooling Completed
Demographics Similar to Brazilians by No Schooling Completed
In terms of no schooling completed, the demographic groups most similar to Brazilians are Dutch West Indian (2.1%, a difference of 0.050%), Comanche (2.1%, a difference of 0.060%), Egyptian (2.1%, a difference of 0.15%), Cheyenne (2.1%, a difference of 0.23%), and Albanian (2.1%, a difference of 0.28%).
| Demographics | Rating | Rank | No Schooling Completed |
| Immigrants | Korea | 66.7 /100 | #158 | Good 2.0% |
| Immigrants | Spain | 66.4 /100 | #159 | Good 2.0% |
| Kenyans | 65.7 /100 | #160 | Good 2.0% |
| Ugandans | 64.6 /100 | #161 | Good 2.0% |
| Immigrants | Brazil | 63.8 /100 | #162 | Good 2.1% |
| Albanians | 62.2 /100 | #163 | Good 2.1% |
| Comanche | 60.7 /100 | #164 | Good 2.1% |
| Brazilians | 60.2 /100 | #165 | Good 2.1% |
| Dutch West Indians | 59.9 /100 | #166 | Average 2.1% |
| Egyptians | 59.2 /100 | #167 | Average 2.1% |
| Cheyenne | 58.6 /100 | #168 | Average 2.1% |
| Apache | 56.7 /100 | #169 | Average 2.1% |
| Argentineans | 56.0 /100 | #170 | Average 2.1% |
| Immigrants | Poland | 55.2 /100 | #171 | Average 2.1% |
| Immigrants | Argentina | 52.7 /100 | #172 | Average 2.1% |
Demographics Similar to French Canadians by No Schooling Completed
In terms of no schooling completed, the demographic groups most similar to French Canadians are Scandinavian (1.5%, a difference of 0.010%), Czech (1.5%, a difference of 0.54%), Lumbee (1.5%, a difference of 0.91%), French (1.5%, a difference of 1.1%), and Pennsylvania German (1.5%, a difference of 1.1%).
| Demographics | Rating | Rank | No Schooling Completed |
| Chinese | 100.0 /100 | #21 | Exceptional 1.5% |
| Alaska Natives | 100.0 /100 | #22 | Exceptional 1.5% |
| Europeans | 100.0 /100 | #23 | Exceptional 1.5% |
| Pennsylvania Germans | 100.0 /100 | #24 | Exceptional 1.5% |
| French | 100.0 /100 | #25 | Exceptional 1.5% |
| Czechs | 100.0 /100 | #26 | Exceptional 1.5% |
| Scandinavians | 100.0 /100 | #27 | Exceptional 1.5% |
| French Canadians | 100.0 /100 | #28 | Exceptional 1.5% |
| Lumbee | 100.0 /100 | #29 | Exceptional 1.5% |
| British | 100.0 /100 | #30 | Exceptional 1.5% |
| Inupiat | 100.0 /100 | #31 | Exceptional 1.5% |
| Swiss | 100.0 /100 | #32 | Exceptional 1.5% |
| Italians | 100.0 /100 | #33 | Exceptional 1.5% |
| Latvians | 100.0 /100 | #34 | Exceptional 1.5% |
| Eastern Europeans | 100.0 /100 | #35 | Exceptional 1.6% |