Bolivian vs Immigrants from Vietnam 10th Grade
COMPARE
Bolivian
Immigrants from Vietnam
10th Grade
10th Grade Comparison
Bolivians
Immigrants from Vietnam
93.2%
10TH GRADE
6.7/ 100
METRIC RATING
224th/ 347
METRIC RANK
91.2%
10TH GRADE
0.0/ 100
METRIC RATING
303rd/ 347
METRIC RANK
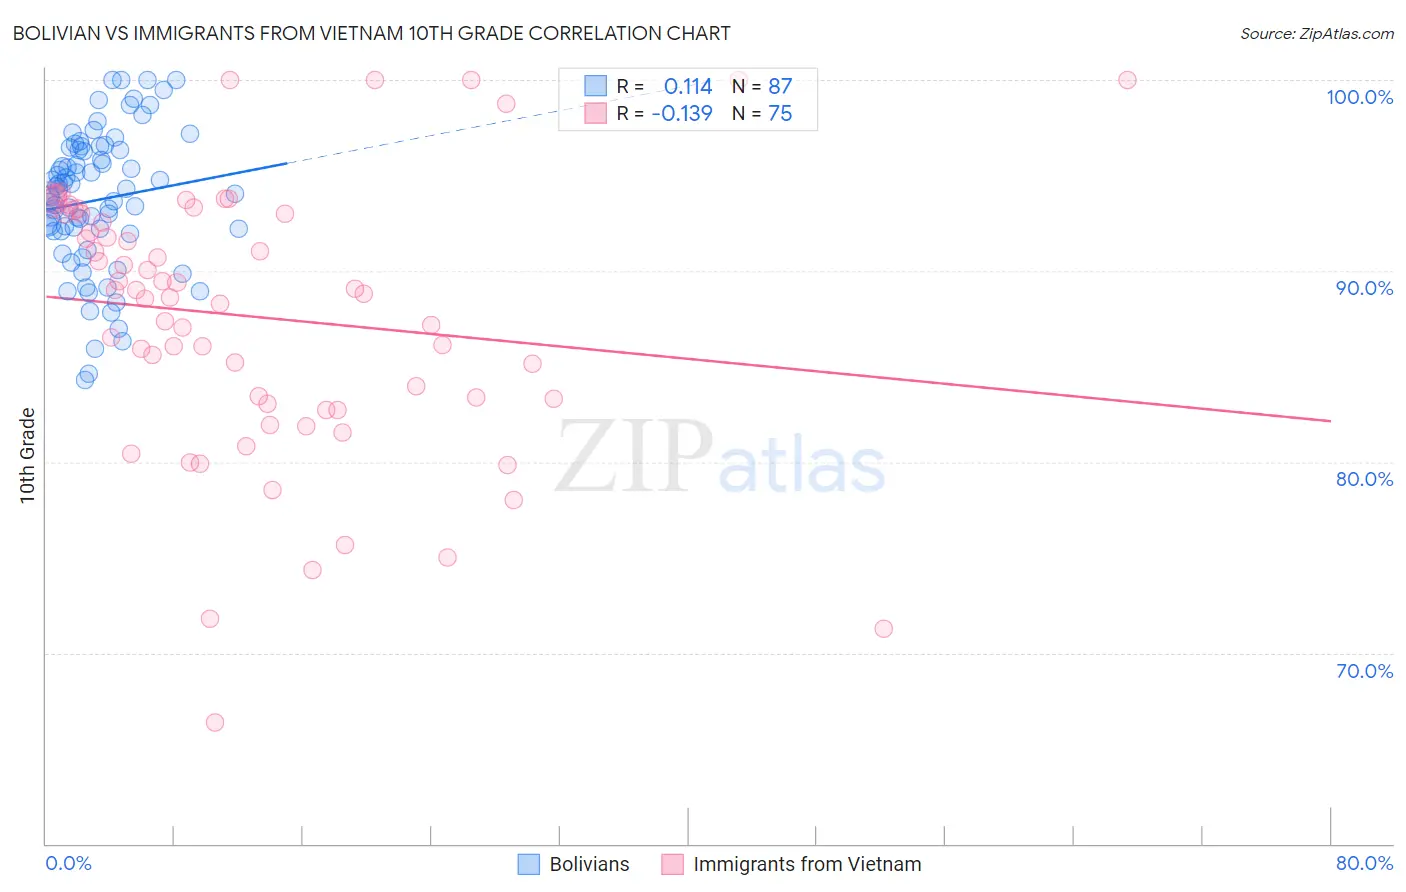
Bolivian vs Immigrants from Vietnam 10th Grade Correlation Chart
The statistical analysis conducted on geographies consisting of 184,666,822 people shows a poor positive correlation between the proportion of Bolivians and percentage of population with at least 10th grade education in the United States with a correlation coefficient (R) of 0.114 and weighted average of 93.2%. Similarly, the statistical analysis conducted on geographies consisting of 404,843,921 people shows a poor negative correlation between the proportion of Immigrants from Vietnam and percentage of population with at least 10th grade education in the United States with a correlation coefficient (R) of -0.139 and weighted average of 91.2%, a difference of 2.2%.
10th Grade Correlation Summary
| Measurement | Bolivian | Immigrants from Vietnam |
| Minimum | 84.3% | 66.3% |
| Maximum | 100.0% | 100.0% |
| Range | 15.7% | 33.7% |
| Mean | 93.7% | 87.6% |
| Median | 94.0% | 88.8% |
| Interquartile 25% (IQ1) | 92.0% | 83.1% |
| Interquartile 75% (IQ3) | 96.3% | 93.0% |
| Interquartile Range (IQR) | 4.3% | 10.0% |
| Standard Deviation (Sample) | 3.6% | 7.1% |
| Standard Deviation (Population) | 3.6% | 7.0% |
Similar Demographics by 10th Grade
Demographics Similar to Bolivians by 10th Grade
In terms of 10th grade, the demographic groups most similar to Bolivians are Somali (93.2%, a difference of 0.020%), Korean (93.2%, a difference of 0.020%), Black/African American (93.2%, a difference of 0.020%), Immigrants from Sierra Leone (93.2%, a difference of 0.030%), and Immigrants from China (93.2%, a difference of 0.030%).
| Demographics | Rating | Rank | 10th Grade |
| Portuguese | 12.1 /100 | #217 | Poor 93.3% |
| Immigrants | Liberia | 10.2 /100 | #218 | Poor 93.3% |
| Seminole | 10.2 /100 | #219 | Poor 93.3% |
| Tongans | 9.5 /100 | #220 | Tragic 93.3% |
| Immigrants | Southern Europe | 8.9 /100 | #221 | Tragic 93.2% |
| Ethiopians | 7.9 /100 | #222 | Tragic 93.2% |
| Immigrants | Sierra Leone | 7.6 /100 | #223 | Tragic 93.2% |
| Bolivians | 6.7 /100 | #224 | Tragic 93.2% |
| Somalis | 6.2 /100 | #225 | Tragic 93.2% |
| Koreans | 6.1 /100 | #226 | Tragic 93.2% |
| Blacks/African Americans | 6.0 /100 | #227 | Tragic 93.2% |
| Immigrants | China | 5.9 /100 | #228 | Tragic 93.2% |
| Immigrants | Ethiopia | 5.1 /100 | #229 | Tragic 93.1% |
| Immigrants | Africa | 5.0 /100 | #230 | Tragic 93.1% |
| South American Indians | 4.9 /100 | #231 | Tragic 93.1% |
Demographics Similar to Immigrants from Vietnam by 10th Grade
In terms of 10th grade, the demographic groups most similar to Immigrants from Vietnam are Immigrants from Guyana (91.2%, a difference of 0.020%), Japanese (91.2%, a difference of 0.030%), Pima (91.2%, a difference of 0.060%), Immigrants from Dominica (91.1%, a difference of 0.070%), and Yaqui (91.1%, a difference of 0.13%).
| Demographics | Rating | Rank | 10th Grade |
| Immigrants | Grenada | 0.0 /100 | #296 | Tragic 91.6% |
| Fijians | 0.0 /100 | #297 | Tragic 91.5% |
| Cubans | 0.0 /100 | #298 | Tragic 91.5% |
| Immigrants | Haiti | 0.0 /100 | #299 | Tragic 91.4% |
| Guyanese | 0.0 /100 | #300 | Tragic 91.4% |
| Japanese | 0.0 /100 | #301 | Tragic 91.2% |
| Immigrants | Guyana | 0.0 /100 | #302 | Tragic 91.2% |
| Immigrants | Vietnam | 0.0 /100 | #303 | Tragic 91.2% |
| Pima | 0.0 /100 | #304 | Tragic 91.2% |
| Immigrants | Dominica | 0.0 /100 | #305 | Tragic 91.1% |
| Yaqui | 0.0 /100 | #306 | Tragic 91.1% |
| Immigrants | Fiji | 0.0 /100 | #307 | Tragic 91.0% |
| Immigrants | Bangladesh | 0.0 /100 | #308 | Tragic 91.0% |
| Immigrants | Immigrants | 0.0 /100 | #309 | Tragic 91.0% |
| Vietnamese | 0.0 /100 | #310 | Tragic 90.9% |