Black/African American vs Immigrants from Sweden College, 1 year or more
COMPARE
Black/African American
Immigrants from Sweden
College, 1 year or more
College, 1 year or more Comparison
Blacks/African Americans
Immigrants from Sweden
53.3%
COLLEGE, 1 YEAR OR MORE
0.0/ 100
METRIC RATING
293rd/ 347
METRIC RANK
66.8%
COLLEGE, 1 YEAR OR MORE
100.0/ 100
METRIC RATING
13th/ 347
METRIC RANK
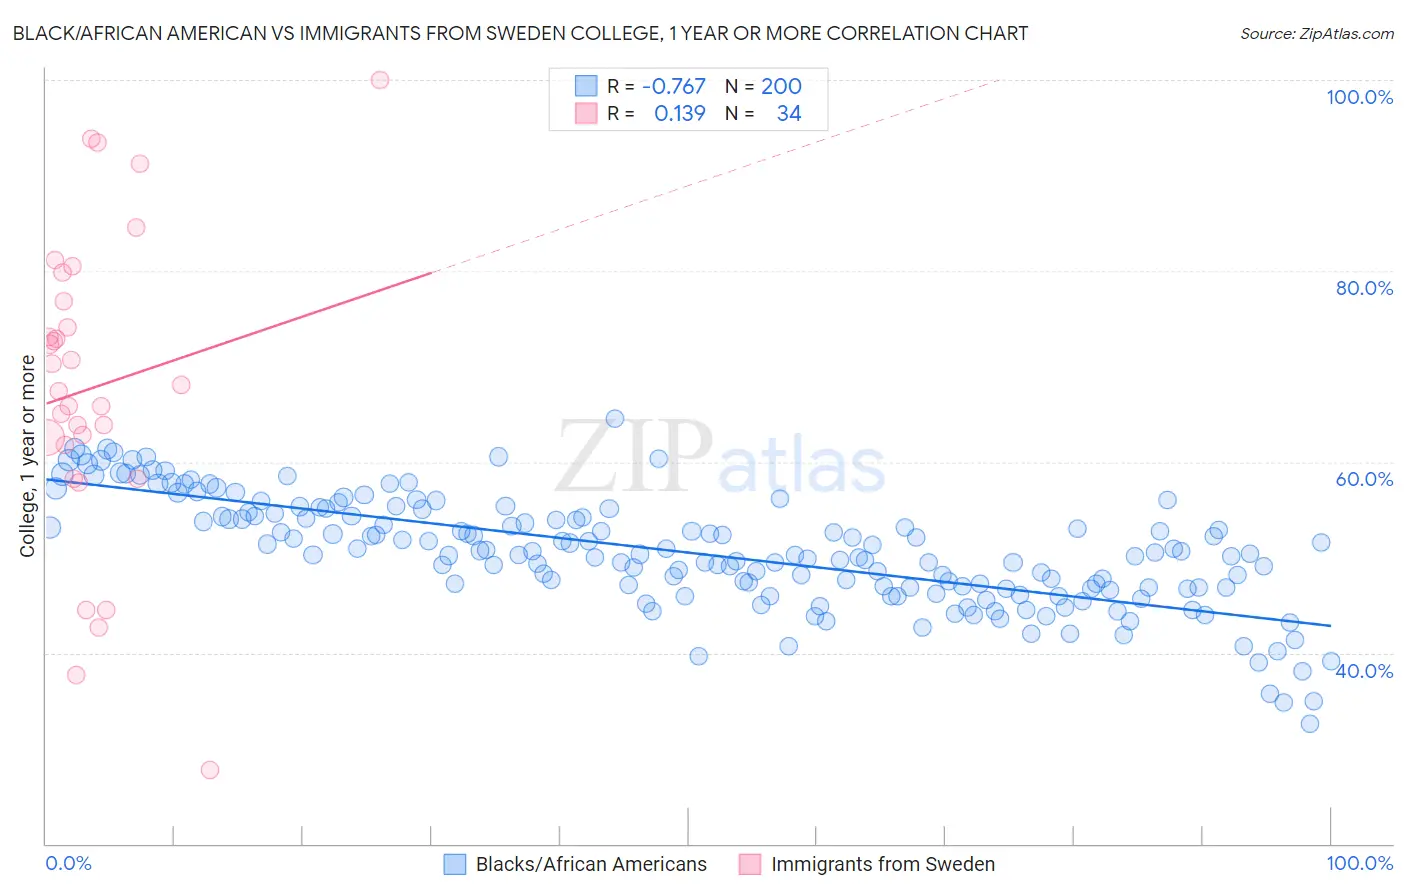
Black/African American vs Immigrants from Sweden College, 1 year or more Correlation Chart
The statistical analysis conducted on geographies consisting of 566,034,160 people shows a strong negative correlation between the proportion of Blacks/African Americans and percentage of population with at least college, 1 year or more education in the United States with a correlation coefficient (R) of -0.767 and weighted average of 53.3%. Similarly, the statistical analysis conducted on geographies consisting of 164,737,293 people shows a poor positive correlation between the proportion of Immigrants from Sweden and percentage of population with at least college, 1 year or more education in the United States with a correlation coefficient (R) of 0.139 and weighted average of 66.8%, a difference of 25.4%.
College, 1 year or more Correlation Summary
| Measurement | Black/African American | Immigrants from Sweden |
| Minimum | 32.6% | 27.7% |
| Maximum | 64.6% | 100.0% |
| Range | 32.0% | 72.3% |
| Mean | 50.5% | 67.8% |
| Median | 50.3% | 67.8% |
| Interquartile 25% (IQ1) | 46.8% | 61.7% |
| Interquartile 75% (IQ3) | 54.3% | 76.8% |
| Interquartile Range (IQR) | 7.5% | 15.1% |
| Standard Deviation (Sample) | 5.8% | 16.1% |
| Standard Deviation (Population) | 5.8% | 15.9% |
Similar Demographics by College, 1 year or more
Demographics Similar to Blacks/African Americans by College, 1 year or more
In terms of college, 1 year or more, the demographic groups most similar to Blacks/African Americans are Chickasaw (53.3%, a difference of 0.020%), Cuban (53.4%, a difference of 0.15%), Alaskan Athabascan (53.4%, a difference of 0.20%), Cherokee (53.2%, a difference of 0.21%), and Alaska Native (53.4%, a difference of 0.22%).
| Demographics | Rating | Rank | College, 1 year or more |
| Central American Indians | 0.1 /100 | #286 | Tragic 53.5% |
| Immigrants | Belize | 0.1 /100 | #287 | Tragic 53.5% |
| Alaska Natives | 0.0 /100 | #288 | Tragic 53.4% |
| Immigrants | Ecuador | 0.0 /100 | #289 | Tragic 53.4% |
| Alaskan Athabascans | 0.0 /100 | #290 | Tragic 53.4% |
| Cubans | 0.0 /100 | #291 | Tragic 53.4% |
| Chickasaw | 0.0 /100 | #292 | Tragic 53.3% |
| Blacks/African Americans | 0.0 /100 | #293 | Tragic 53.3% |
| Cherokee | 0.0 /100 | #294 | Tragic 53.2% |
| Yaqui | 0.0 /100 | #295 | Tragic 53.2% |
| Sioux | 0.0 /100 | #296 | Tragic 53.0% |
| Paiute | 0.0 /100 | #297 | Tragic 52.9% |
| Immigrants | Dominica | 0.0 /100 | #298 | Tragic 52.5% |
| Immigrants | Nicaragua | 0.0 /100 | #299 | Tragic 52.4% |
| Choctaw | 0.0 /100 | #300 | Tragic 52.3% |
Demographics Similar to Immigrants from Sweden by College, 1 year or more
In terms of college, 1 year or more, the demographic groups most similar to Immigrants from Sweden are Burmese (66.7%, a difference of 0.19%), Cambodian (66.7%, a difference of 0.19%), Immigrants from Japan (66.7%, a difference of 0.23%), Cypriot (67.0%, a difference of 0.31%), and Immigrants from Eastern Asia (66.6%, a difference of 0.34%).
| Demographics | Rating | Rank | College, 1 year or more |
| Immigrants | Iran | 100.0 /100 | #6 | Exceptional 69.5% |
| Okinawans | 100.0 /100 | #7 | Exceptional 69.0% |
| Thais | 100.0 /100 | #8 | Exceptional 68.6% |
| Immigrants | Israel | 100.0 /100 | #9 | Exceptional 67.8% |
| Immigrants | Australia | 100.0 /100 | #10 | Exceptional 67.7% |
| Immigrants | South Central Asia | 100.0 /100 | #11 | Exceptional 67.1% |
| Cypriots | 100.0 /100 | #12 | Exceptional 67.0% |
| Immigrants | Sweden | 100.0 /100 | #13 | Exceptional 66.8% |
| Burmese | 100.0 /100 | #14 | Exceptional 66.7% |
| Cambodians | 100.0 /100 | #15 | Exceptional 66.7% |
| Immigrants | Japan | 100.0 /100 | #16 | Exceptional 66.7% |
| Immigrants | Eastern Asia | 100.0 /100 | #17 | Exceptional 66.6% |
| Eastern Europeans | 100.0 /100 | #18 | Exceptional 66.6% |
| Immigrants | Switzerland | 100.0 /100 | #19 | Exceptional 66.5% |
| Immigrants | Korea | 100.0 /100 | #20 | Exceptional 66.5% |