Colombian vs Immigrants from Scotland 12th Grade, No Diploma
COMPARE
Colombian
Immigrants from Scotland
12th Grade, No Diploma
12th Grade, No Diploma Comparison
Colombians
Immigrants from Scotland
90.4%
12TH GRADE, NO DIPLOMA
6.6/ 100
METRIC RATING
220th/ 347
METRIC RANK
93.0%
12TH GRADE, NO DIPLOMA
99.9/ 100
METRIC RATING
33rd/ 347
METRIC RANK
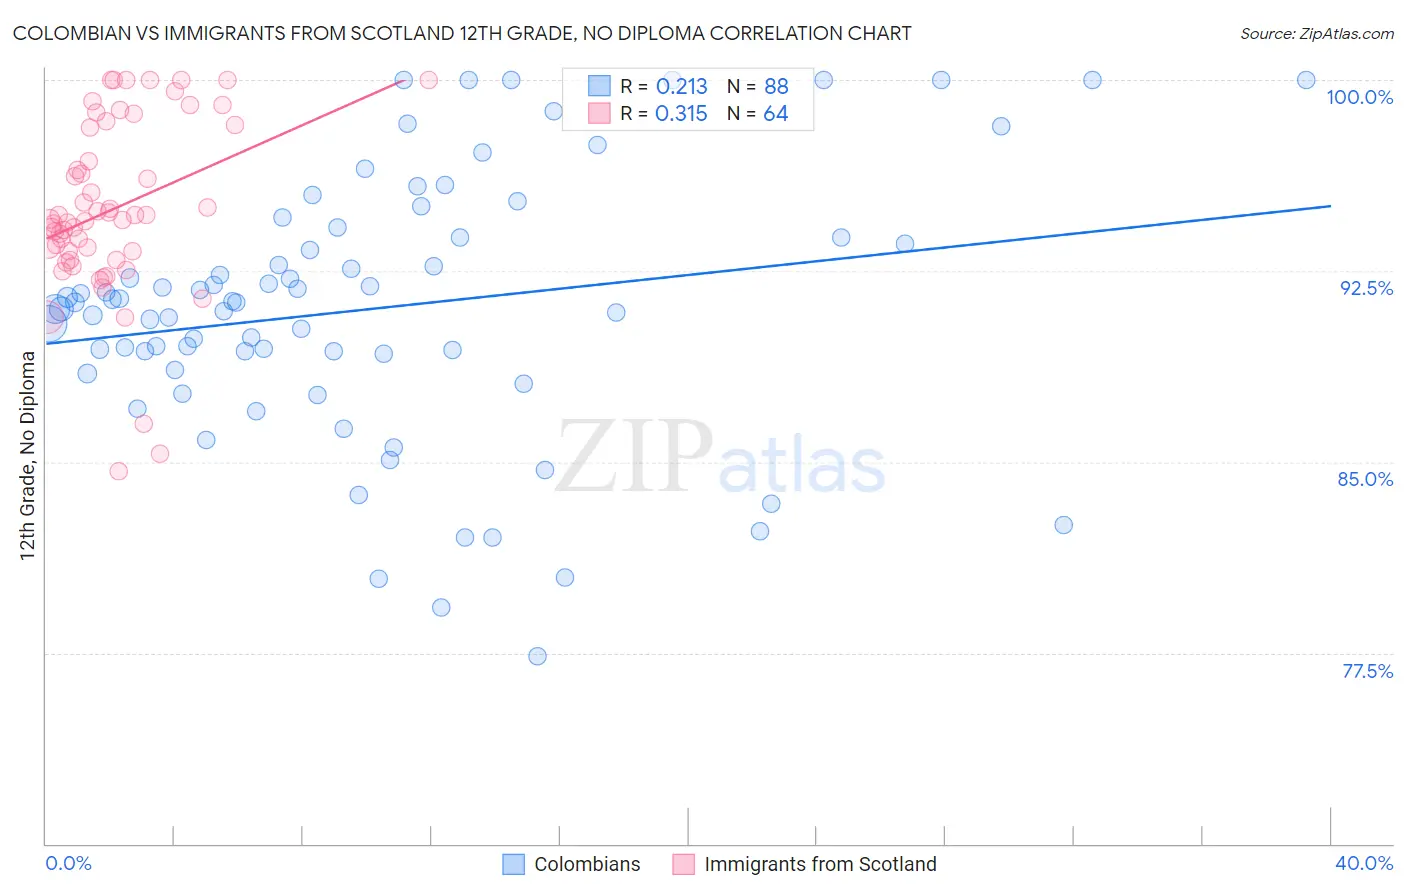
Colombian vs Immigrants from Scotland 12th Grade, No Diploma Correlation Chart
The statistical analysis conducted on geographies consisting of 419,701,311 people shows a weak positive correlation between the proportion of Colombians and percentage of population with at least 12th grade (no diploma) education in the United States with a correlation coefficient (R) of 0.213 and weighted average of 90.4%. Similarly, the statistical analysis conducted on geographies consisting of 196,398,887 people shows a mild positive correlation between the proportion of Immigrants from Scotland and percentage of population with at least 12th grade (no diploma) education in the United States with a correlation coefficient (R) of 0.315 and weighted average of 93.0%, a difference of 2.9%.
12th Grade, No Diploma Correlation Summary
| Measurement | Colombian | Immigrants from Scotland |
| Minimum | 77.3% | 84.6% |
| Maximum | 100.0% | 100.0% |
| Range | 22.7% | 15.4% |
| Mean | 91.0% | 94.9% |
| Median | 91.3% | 94.5% |
| Interquartile 25% (IQ1) | 88.9% | 93.1% |
| Interquartile 75% (IQ3) | 93.8% | 98.2% |
| Interquartile Range (IQR) | 4.9% | 5.1% |
| Standard Deviation (Sample) | 5.2% | 3.4% |
| Standard Deviation (Population) | 5.1% | 3.4% |
Similar Demographics by 12th Grade, No Diploma
Demographics Similar to Colombians by 12th Grade, No Diploma
In terms of 12th grade, no diploma, the demographic groups most similar to Colombians are Uruguayan (90.4%, a difference of 0.020%), Shoshone (90.5%, a difference of 0.040%), Cherokee (90.5%, a difference of 0.040%), Immigrants from Cameroon (90.5%, a difference of 0.040%), and Arapaho (90.5%, a difference of 0.050%).
| Demographics | Rating | Rank | 12th Grade, No Diploma |
| Costa Ricans | 9.4 /100 | #213 | Tragic 90.5% |
| Immigrants | Africa | 8.5 /100 | #214 | Tragic 90.5% |
| Arapaho | 7.7 /100 | #215 | Tragic 90.5% |
| Shoshone | 7.5 /100 | #216 | Tragic 90.5% |
| Cherokee | 7.4 /100 | #217 | Tragic 90.5% |
| Immigrants | Cameroon | 7.4 /100 | #218 | Tragic 90.5% |
| Uruguayans | 7.0 /100 | #219 | Tragic 90.4% |
| Colombians | 6.6 /100 | #220 | Tragic 90.4% |
| Immigrants | Liberia | 5.7 /100 | #221 | Tragic 90.4% |
| Immigrants | Somalia | 5.3 /100 | #222 | Tragic 90.4% |
| South Americans | 5.0 /100 | #223 | Tragic 90.3% |
| Immigrants | Panama | 4.8 /100 | #224 | Tragic 90.3% |
| Chickasaw | 4.8 /100 | #225 | Tragic 90.3% |
| Immigrants | Zaire | 4.6 /100 | #226 | Tragic 90.3% |
| Nigerians | 4.5 /100 | #227 | Tragic 90.3% |
Demographics Similar to Immigrants from Scotland by 12th Grade, No Diploma
In terms of 12th grade, no diploma, the demographic groups most similar to Immigrants from Scotland are Okinawan (93.0%, a difference of 0.020%), European (93.1%, a difference of 0.030%), English (93.0%, a difference of 0.030%), Scottish (93.0%, a difference of 0.030%), and Irish (93.0%, a difference of 0.030%).
| Demographics | Rating | Rank | 12th Grade, No Diploma |
| Russians | 99.9 /100 | #26 | Exceptional 93.2% |
| Cypriots | 99.9 /100 | #27 | Exceptional 93.1% |
| Immigrants | Northern Europe | 99.9 /100 | #28 | Exceptional 93.1% |
| Iranians | 99.9 /100 | #29 | Exceptional 93.1% |
| Immigrants | Lithuania | 99.9 /100 | #30 | Exceptional 93.1% |
| Immigrants | Ireland | 99.9 /100 | #31 | Exceptional 93.1% |
| Europeans | 99.9 /100 | #32 | Exceptional 93.1% |
| Immigrants | Scotland | 99.9 /100 | #33 | Exceptional 93.0% |
| Okinawans | 99.9 /100 | #34 | Exceptional 93.0% |
| English | 99.9 /100 | #35 | Exceptional 93.0% |
| Scottish | 99.9 /100 | #36 | Exceptional 93.0% |
| Irish | 99.9 /100 | #37 | Exceptional 93.0% |
| Tlingit-Haida | 99.8 /100 | #38 | Exceptional 93.0% |
| Immigrants | Austria | 99.8 /100 | #39 | Exceptional 93.0% |
| Turks | 99.8 /100 | #40 | Exceptional 93.0% |