Black/African American vs Immigrants from Scotland 8th Grade
COMPARE
Black/African American
Immigrants from Scotland
8th Grade
8th Grade Comparison
Blacks/African Americans
Immigrants from Scotland
95.6%
8TH GRADE
34.8/ 100
METRIC RATING
185th/ 347
METRIC RANK
96.8%
8TH GRADE
99.9/ 100
METRIC RATING
50th/ 347
METRIC RANK
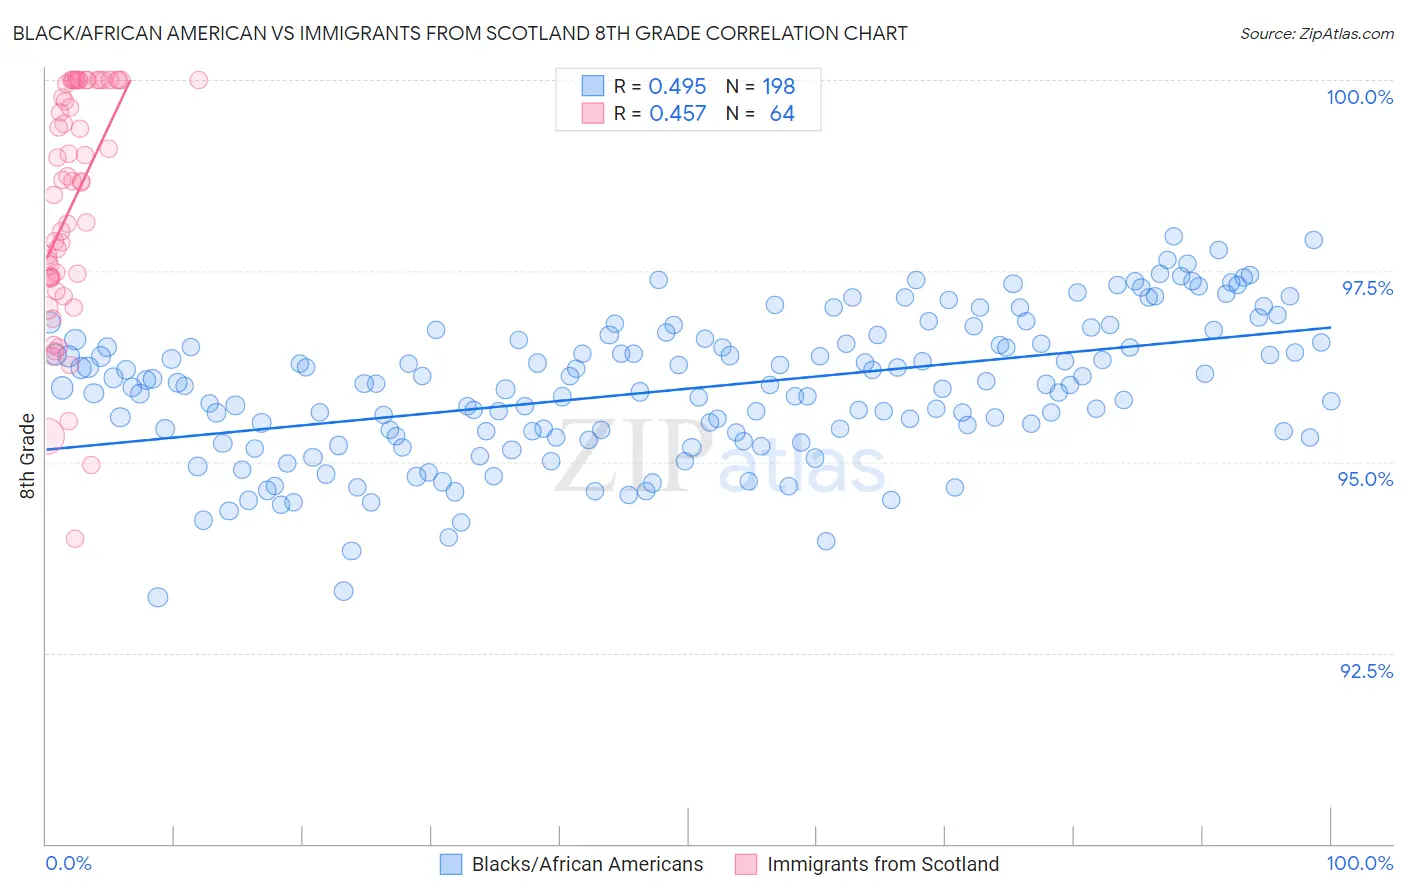
Black/African American vs Immigrants from Scotland 8th Grade Correlation Chart
The statistical analysis conducted on geographies consisting of 561,177,341 people shows a moderate positive correlation between the proportion of Blacks/African Americans and percentage of population with at least 8th grade education in the United States with a correlation coefficient (R) of 0.495 and weighted average of 95.6%. Similarly, the statistical analysis conducted on geographies consisting of 196,398,887 people shows a moderate positive correlation between the proportion of Immigrants from Scotland and percentage of population with at least 8th grade education in the United States with a correlation coefficient (R) of 0.457 and weighted average of 96.8%, a difference of 1.2%.
8th Grade Correlation Summary
| Measurement | Black/African American | Immigrants from Scotland |
| Minimum | 93.2% | 94.0% |
| Maximum | 98.0% | 100.0% |
| Range | 4.7% | 6.0% |
| Mean | 96.0% | 98.4% |
| Median | 96.0% | 98.7% |
| Interquartile 25% (IQ1) | 95.3% | 97.4% |
| Interquartile 75% (IQ3) | 96.6% | 100.0% |
| Interquartile Range (IQR) | 1.3% | 2.6% |
| Standard Deviation (Sample) | 0.93% | 1.5% |
| Standard Deviation (Population) | 0.93% | 1.5% |
Similar Demographics by 8th Grade
Demographics Similar to Blacks/African Americans by 8th Grade
In terms of 8th grade, the demographic groups most similar to Blacks/African Americans are Brazilian (95.6%, a difference of 0.0%), Immigrants from Iraq (95.6%, a difference of 0.010%), Immigrants from Uganda (95.6%, a difference of 0.010%), Sudanese (95.6%, a difference of 0.010%), and Immigrants from Egypt (95.7%, a difference of 0.020%).
| Demographics | Rating | Rank | 8th Grade |
| Venezuelans | 47.5 /100 | #178 | Average 95.7% |
| Immigrants | Brazil | 45.4 /100 | #179 | Average 95.7% |
| Iraqis | 40.5 /100 | #180 | Average 95.7% |
| Immigrants | Spain | 38.7 /100 | #181 | Fair 95.7% |
| Immigrants | Egypt | 37.9 /100 | #182 | Fair 95.7% |
| Immigrants | Iraq | 36.2 /100 | #183 | Fair 95.6% |
| Immigrants | Uganda | 36.0 /100 | #184 | Fair 95.6% |
| Blacks/African Americans | 34.8 /100 | #185 | Fair 95.6% |
| Brazilians | 34.8 /100 | #186 | Fair 95.6% |
| Sudanese | 33.0 /100 | #187 | Fair 95.6% |
| Liberians | 32.4 /100 | #188 | Fair 95.6% |
| Immigrants | Micronesia | 31.6 /100 | #189 | Fair 95.6% |
| Immigrants | Venezuela | 30.8 /100 | #190 | Fair 95.6% |
| Immigrants | Nepal | 30.2 /100 | #191 | Fair 95.6% |
| Pima | 28.6 /100 | #192 | Fair 95.6% |
Demographics Similar to Immigrants from Scotland by 8th Grade
In terms of 8th grade, the demographic groups most similar to Immigrants from Scotland are Estonian (96.8%, a difference of 0.010%), Celtic (96.8%, a difference of 0.010%), Slavic (96.8%, a difference of 0.020%), Greek (96.8%, a difference of 0.040%), and Bulgarian (96.9%, a difference of 0.050%).
| Demographics | Rating | Rank | 8th Grade |
| Aleuts | 99.9 /100 | #43 | Exceptional 96.9% |
| Maltese | 99.9 /100 | #44 | Exceptional 96.9% |
| Northern Europeans | 99.9 /100 | #45 | Exceptional 96.9% |
| Czechoslovakians | 99.9 /100 | #46 | Exceptional 96.9% |
| Bulgarians | 99.9 /100 | #47 | Exceptional 96.9% |
| Slavs | 99.9 /100 | #48 | Exceptional 96.8% |
| Estonians | 99.9 /100 | #49 | Exceptional 96.8% |
| Immigrants | Scotland | 99.9 /100 | #50 | Exceptional 96.8% |
| Celtics | 99.9 /100 | #51 | Exceptional 96.8% |
| Greeks | 99.9 /100 | #52 | Exceptional 96.8% |
| Austrians | 99.9 /100 | #53 | Exceptional 96.7% |
| Serbians | 99.8 /100 | #54 | Exceptional 96.7% |
| Russians | 99.8 /100 | #55 | Exceptional 96.7% |
| Australians | 99.8 /100 | #56 | Exceptional 96.7% |
| Macedonians | 99.8 /100 | #57 | Exceptional 96.7% |