Black/African American vs Nonimmigrants No Schooling Completed
COMPARE
Black/African American
Nonimmigrants
No Schooling Completed
No Schooling Completed Comparison
Blacks/African Americans
Nonimmigrants
2.1%
NO SCHOOLING COMPLETED
41.4/ 100
METRIC RATING
183rd/ 347
METRIC RANK
1.8%
NO SCHOOLING COMPLETED
98.5/ 100
METRIC RATING
94th/ 347
METRIC RANK
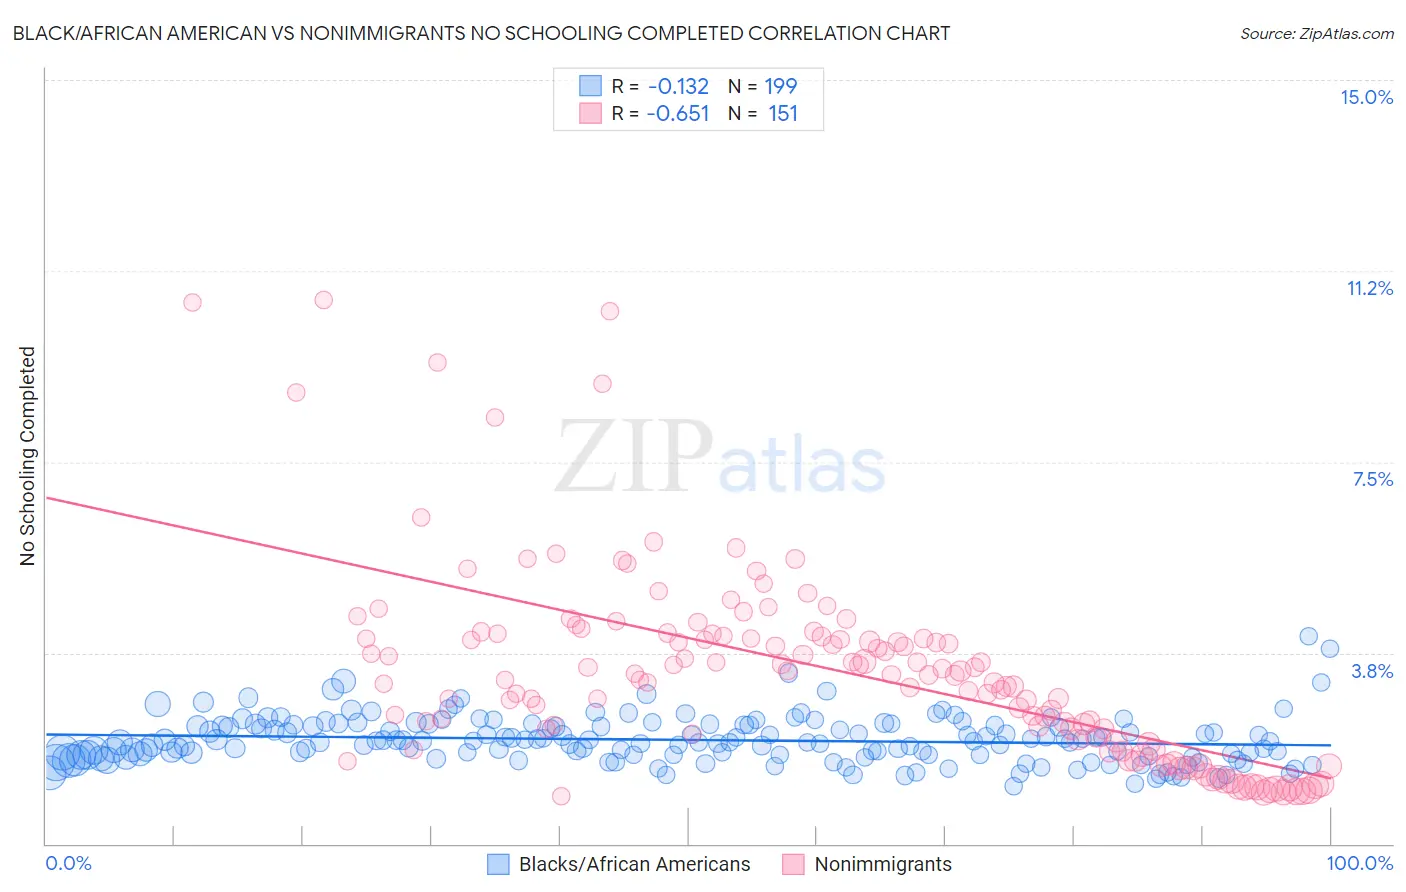
Black/African American vs Nonimmigrants No Schooling Completed Correlation Chart
The statistical analysis conducted on geographies consisting of 551,024,391 people shows a poor negative correlation between the proportion of Blacks/African Americans and percentage of population with no schooling in the United States with a correlation coefficient (R) of -0.132 and weighted average of 2.1%. Similarly, the statistical analysis conducted on geographies consisting of 562,676,251 people shows a significant negative correlation between the proportion of Nonimmigrants and percentage of population with no schooling in the United States with a correlation coefficient (R) of -0.651 and weighted average of 1.8%, a difference of 17.8%.
No Schooling Completed Correlation Summary
| Measurement | Black/African American | Nonimmigrants |
| Minimum | 1.1% | 0.93% |
| Maximum | 4.1% | 10.7% |
| Range | 2.9% | 9.8% |
| Mean | 2.0% | 3.4% |
| Median | 2.0% | 3.3% |
| Interquartile 25% (IQ1) | 1.7% | 2.0% |
| Interquartile 75% (IQ3) | 2.3% | 4.1% |
| Interquartile Range (IQR) | 0.59% | 2.1% |
| Standard Deviation (Sample) | 0.46% | 1.9% |
| Standard Deviation (Population) | 0.46% | 1.9% |
Similar Demographics by No Schooling Completed
Demographics Similar to Blacks/African Americans by No Schooling Completed
In terms of no schooling completed, the demographic groups most similar to Blacks/African Americans are Pima (2.1%, a difference of 0.020%), Mongolian (2.1%, a difference of 0.090%), French American Indian (2.1%, a difference of 0.10%), Immigrants from Taiwan (2.1%, a difference of 0.15%), and Portuguese (2.1%, a difference of 0.33%).
| Demographics | Rating | Rank | No Schooling Completed |
| Panamanians | 45.2 /100 | #176 | Average 2.1% |
| Arapaho | 45.0 /100 | #177 | Average 2.1% |
| Pakistanis | 44.7 /100 | #178 | Average 2.1% |
| Immigrants | Kazakhstan | 44.3 /100 | #179 | Average 2.1% |
| Portuguese | 43.9 /100 | #180 | Average 2.1% |
| Immigrants | Taiwan | 42.6 /100 | #181 | Average 2.1% |
| French American Indians | 42.2 /100 | #182 | Average 2.1% |
| Blacks/African Americans | 41.4 /100 | #183 | Average 2.1% |
| Pima | 41.3 /100 | #184 | Average 2.1% |
| Mongolians | 40.8 /100 | #185 | Average 2.1% |
| Immigrants | Bosnia and Herzegovina | 38.6 /100 | #186 | Fair 2.1% |
| Navajo | 36.5 /100 | #187 | Fair 2.1% |
| Immigrants | Kenya | 36.2 /100 | #188 | Fair 2.1% |
| Immigrants | Egypt | 36.1 /100 | #189 | Fair 2.1% |
| Spanish Americans | 32.6 /100 | #190 | Fair 2.1% |
Demographics Similar to Nonimmigrants by No Schooling Completed
In terms of no schooling completed, the demographic groups most similar to Nonimmigrants are Puget Sound Salish (1.8%, a difference of 0.010%), Bhutanese (1.8%, a difference of 0.24%), Immigrants from Ireland (1.8%, a difference of 0.42%), Turkish (1.8%, a difference of 0.50%), and Iranian (1.8%, a difference of 0.70%).
| Demographics | Rating | Rank | No Schooling Completed |
| Osage | 99.2 /100 | #87 | Exceptional 1.8% |
| Immigrants | Western Europe | 99.2 /100 | #88 | Exceptional 1.8% |
| South Africans | 99.1 /100 | #89 | Exceptional 1.8% |
| Sioux | 99.0 /100 | #90 | Exceptional 1.8% |
| Immigrants | Germany | 99.0 /100 | #91 | Exceptional 1.8% |
| Romanians | 98.8 /100 | #92 | Exceptional 1.8% |
| Turks | 98.7 /100 | #93 | Exceptional 1.8% |
| Immigrants | Nonimmigrants | 98.5 /100 | #94 | Exceptional 1.8% |
| Puget Sound Salish | 98.5 /100 | #95 | Exceptional 1.8% |
| Bhutanese | 98.4 /100 | #96 | Exceptional 1.8% |
| Immigrants | Ireland | 98.4 /100 | #97 | Exceptional 1.8% |
| Iranians | 98.2 /100 | #98 | Exceptional 1.8% |
| Choctaw | 98.1 /100 | #99 | Exceptional 1.8% |
| Immigrants | Singapore | 98.0 /100 | #100 | Exceptional 1.8% |
| Immigrants | Czechoslovakia | 97.9 /100 | #101 | Exceptional 1.8% |