Blackfeet vs Spanish American Indian 10th Grade
COMPARE
Blackfeet
Spanish American Indian
10th Grade
10th Grade Comparison
Blackfeet
Spanish American Indians
93.7%
10TH GRADE
42.8/ 100
METRIC RATING
180th/ 347
METRIC RANK
86.2%
10TH GRADE
0.0/ 100
METRIC RATING
346th/ 347
METRIC RANK
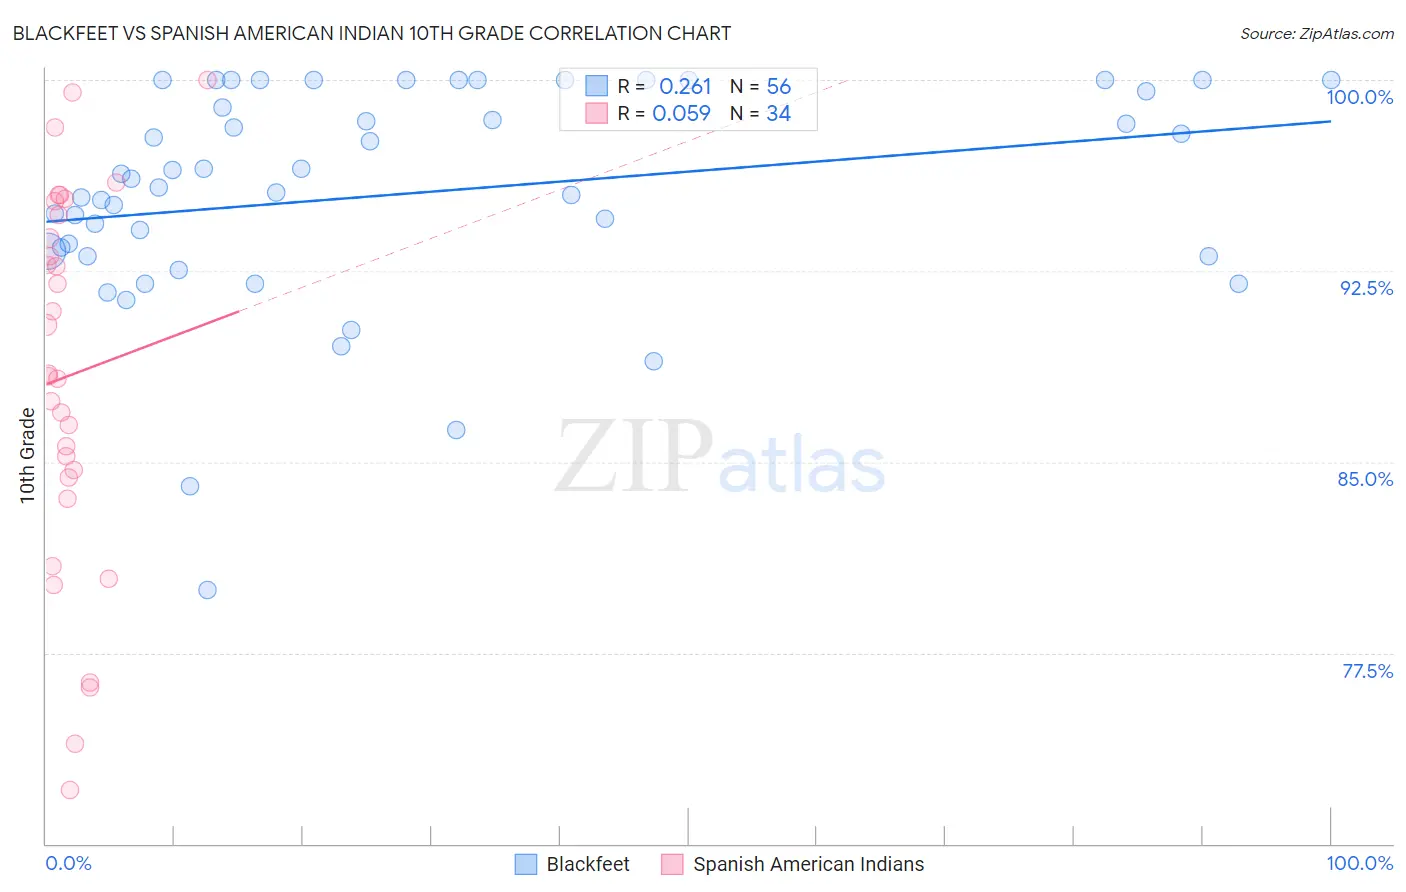
Blackfeet vs Spanish American Indian 10th Grade Correlation Chart
The statistical analysis conducted on geographies consisting of 309,582,133 people shows a weak positive correlation between the proportion of Blackfeet and percentage of population with at least 10th grade education in the United States with a correlation coefficient (R) of 0.261 and weighted average of 93.7%. Similarly, the statistical analysis conducted on geographies consisting of 73,147,813 people shows a slight positive correlation between the proportion of Spanish American Indians and percentage of population with at least 10th grade education in the United States with a correlation coefficient (R) of 0.059 and weighted average of 86.2%, a difference of 8.7%.
10th Grade Correlation Summary
| Measurement | Blackfeet | Spanish American Indian |
| Minimum | 80.0% | 72.1% |
| Maximum | 100.0% | 100.0% |
| Range | 20.0% | 27.9% |
| Mean | 95.5% | 88.4% |
| Median | 96.0% | 88.4% |
| Interquartile 25% (IQ1) | 93.2% | 84.4% |
| Interquartile 75% (IQ3) | 99.8% | 94.7% |
| Interquartile Range (IQR) | 6.6% | 10.3% |
| Standard Deviation (Sample) | 4.3% | 7.4% |
| Standard Deviation (Population) | 4.3% | 7.3% |
Similar Demographics by 10th Grade
Demographics Similar to Blackfeet by 10th Grade
In terms of 10th grade, the demographic groups most similar to Blackfeet are Immigrants from Northern Africa (93.7%, a difference of 0.010%), Paraguayan (93.7%, a difference of 0.020%), Sierra Leonean (93.7%, a difference of 0.030%), Immigrants from Argentina (93.7%, a difference of 0.040%), and Immigrants from Lebanon (93.7%, a difference of 0.040%).
| Demographics | Rating | Rank | 10th Grade |
| Spaniards | 50.3 /100 | #173 | Average 93.7% |
| Argentineans | 50.0 /100 | #174 | Average 93.7% |
| Immigrants | Nepal | 49.6 /100 | #175 | Average 93.7% |
| Immigrants | Argentina | 47.1 /100 | #176 | Average 93.7% |
| Immigrants | Lebanon | 47.1 /100 | #177 | Average 93.7% |
| Sierra Leoneans | 46.1 /100 | #178 | Average 93.7% |
| Paraguayans | 45.3 /100 | #179 | Average 93.7% |
| Blackfeet | 42.8 /100 | #180 | Average 93.7% |
| Immigrants | Northern Africa | 41.6 /100 | #181 | Average 93.7% |
| Colville | 38.8 /100 | #182 | Fair 93.6% |
| Guamanians/Chamorros | 37.1 /100 | #183 | Fair 93.6% |
| Choctaw | 36.6 /100 | #184 | Fair 93.6% |
| Sudanese | 36.6 /100 | #185 | Fair 93.6% |
| Immigrants | Eastern Asia | 35.1 /100 | #186 | Fair 93.6% |
| Liberians | 34.7 /100 | #187 | Fair 93.6% |
Demographics Similar to Spanish American Indians by 10th Grade
In terms of 10th grade, the demographic groups most similar to Spanish American Indians are Immigrants from Mexico (86.2%, a difference of 0.010%), Immigrants from Central America (86.6%, a difference of 0.45%), Immigrants from El Salvador (86.8%, a difference of 0.63%), Yakama (86.9%, a difference of 0.77%), and Immigrants from Guatemala (87.4%, a difference of 1.4%).
| Demographics | Rating | Rank | 10th Grade |
| Hondurans | 0.0 /100 | #333 | Tragic 89.0% |
| Hispanics or Latinos | 0.0 /100 | #334 | Tragic 88.9% |
| Immigrants | Dominican Republic | 0.0 /100 | #335 | Tragic 88.7% |
| Immigrants | Honduras | 0.0 /100 | #336 | Tragic 88.5% |
| Central Americans | 0.0 /100 | #337 | Tragic 88.4% |
| Immigrants | Latin America | 0.0 /100 | #338 | Tragic 88.3% |
| Guatemalans | 0.0 /100 | #339 | Tragic 87.9% |
| Mexicans | 0.0 /100 | #340 | Tragic 87.8% |
| Salvadorans | 0.0 /100 | #341 | Tragic 87.5% |
| Immigrants | Guatemala | 0.0 /100 | #342 | Tragic 87.4% |
| Yakama | 0.0 /100 | #343 | Tragic 86.9% |
| Immigrants | El Salvador | 0.0 /100 | #344 | Tragic 86.8% |
| Immigrants | Central America | 0.0 /100 | #345 | Tragic 86.6% |
| Spanish American Indians | 0.0 /100 | #346 | Tragic 86.2% |
| Immigrants | Mexico | 0.0 /100 | #347 | Tragic 86.2% |