Blackfeet vs Immigrants from Saudi Arabia 10th Grade
COMPARE
Blackfeet
Immigrants from Saudi Arabia
10th Grade
10th Grade Comparison
Blackfeet
Immigrants from Saudi Arabia
93.7%
10TH GRADE
42.8/ 100
METRIC RATING
180th/ 347
METRIC RANK
94.7%
10TH GRADE
99.0/ 100
METRIC RATING
87th/ 347
METRIC RANK
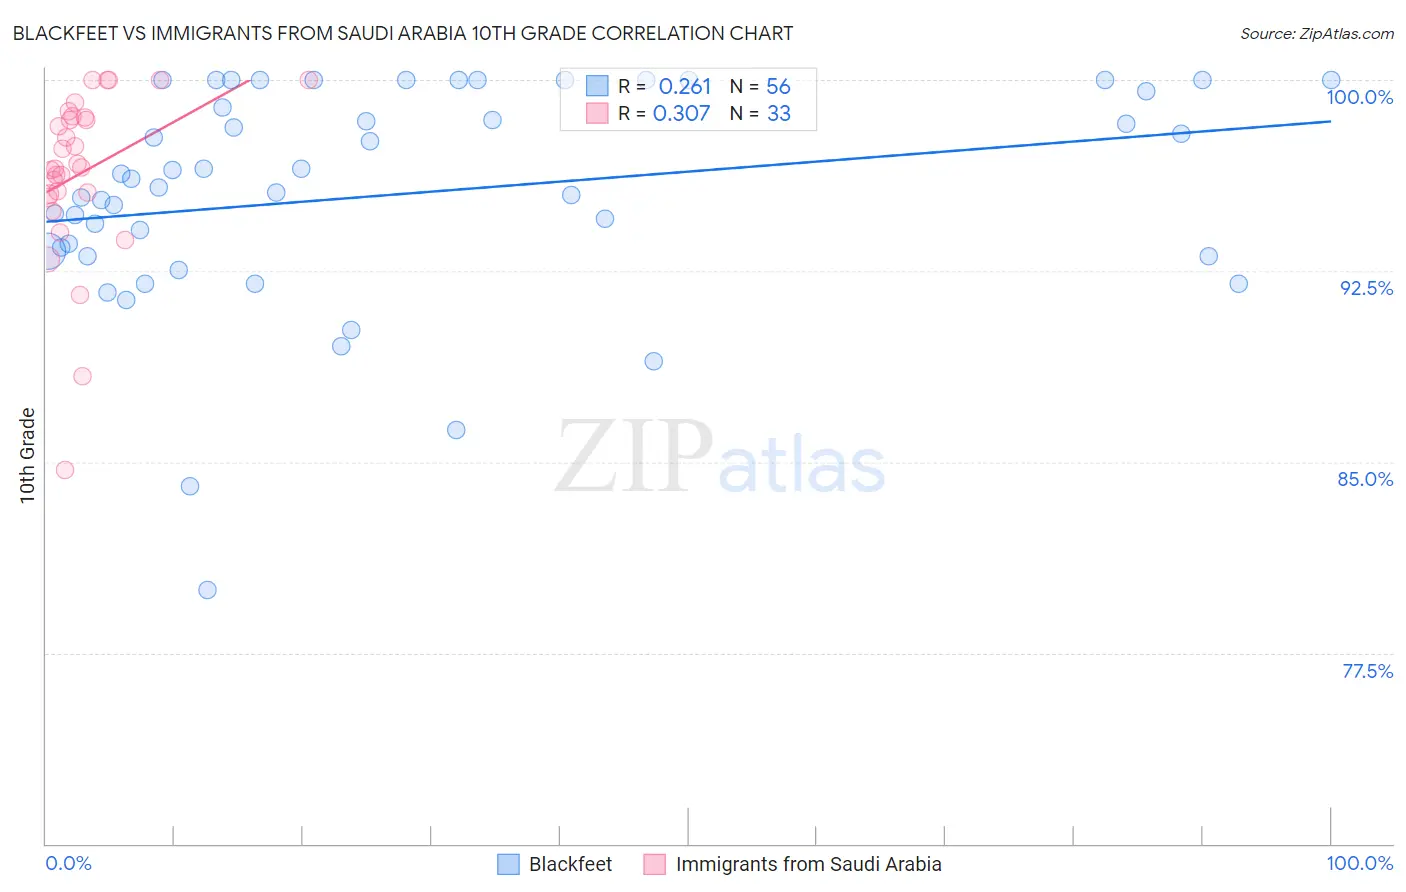
Blackfeet vs Immigrants from Saudi Arabia 10th Grade Correlation Chart
The statistical analysis conducted on geographies consisting of 309,582,133 people shows a weak positive correlation between the proportion of Blackfeet and percentage of population with at least 10th grade education in the United States with a correlation coefficient (R) of 0.261 and weighted average of 93.7%. Similarly, the statistical analysis conducted on geographies consisting of 164,277,573 people shows a mild positive correlation between the proportion of Immigrants from Saudi Arabia and percentage of population with at least 10th grade education in the United States with a correlation coefficient (R) of 0.307 and weighted average of 94.7%, a difference of 1.1%.
10th Grade Correlation Summary
| Measurement | Blackfeet | Immigrants from Saudi Arabia |
| Minimum | 80.0% | 84.7% |
| Maximum | 100.0% | 100.0% |
| Range | 20.0% | 15.3% |
| Mean | 95.5% | 96.4% |
| Median | 96.0% | 96.6% |
| Interquartile 25% (IQ1) | 93.2% | 95.4% |
| Interquartile 75% (IQ3) | 99.8% | 98.5% |
| Interquartile Range (IQR) | 6.6% | 3.1% |
| Standard Deviation (Sample) | 4.3% | 3.3% |
| Standard Deviation (Population) | 4.3% | 3.3% |
Similar Demographics by 10th Grade
Demographics Similar to Blackfeet by 10th Grade
In terms of 10th grade, the demographic groups most similar to Blackfeet are Immigrants from Northern Africa (93.7%, a difference of 0.010%), Paraguayan (93.7%, a difference of 0.020%), Sierra Leonean (93.7%, a difference of 0.030%), Immigrants from Argentina (93.7%, a difference of 0.040%), and Immigrants from Lebanon (93.7%, a difference of 0.040%).
| Demographics | Rating | Rank | 10th Grade |
| Spaniards | 50.3 /100 | #173 | Average 93.7% |
| Argentineans | 50.0 /100 | #174 | Average 93.7% |
| Immigrants | Nepal | 49.6 /100 | #175 | Average 93.7% |
| Immigrants | Argentina | 47.1 /100 | #176 | Average 93.7% |
| Immigrants | Lebanon | 47.1 /100 | #177 | Average 93.7% |
| Sierra Leoneans | 46.1 /100 | #178 | Average 93.7% |
| Paraguayans | 45.3 /100 | #179 | Average 93.7% |
| Blackfeet | 42.8 /100 | #180 | Average 93.7% |
| Immigrants | Northern Africa | 41.6 /100 | #181 | Average 93.7% |
| Colville | 38.8 /100 | #182 | Fair 93.6% |
| Guamanians/Chamorros | 37.1 /100 | #183 | Fair 93.6% |
| Choctaw | 36.6 /100 | #184 | Fair 93.6% |
| Sudanese | 36.6 /100 | #185 | Fair 93.6% |
| Immigrants | Eastern Asia | 35.1 /100 | #186 | Fair 93.6% |
| Liberians | 34.7 /100 | #187 | Fair 93.6% |
Demographics Similar to Immigrants from Saudi Arabia by 10th Grade
In terms of 10th grade, the demographic groups most similar to Immigrants from Saudi Arabia are Immigrants from Japan (94.7%, a difference of 0.0%), Crow (94.7%, a difference of 0.010%), Puget Sound Salish (94.7%, a difference of 0.010%), Immigrants from Western Europe (94.7%, a difference of 0.020%), and Icelander (94.7%, a difference of 0.020%).
| Demographics | Rating | Rank | 10th Grade |
| Immigrants | Denmark | 99.2 /100 | #80 | Exceptional 94.7% |
| Immigrants | Latvia | 99.2 /100 | #81 | Exceptional 94.7% |
| Swiss | 99.1 /100 | #82 | Exceptional 94.7% |
| Immigrants | Western Europe | 99.1 /100 | #83 | Exceptional 94.7% |
| Icelanders | 99.1 /100 | #84 | Exceptional 94.7% |
| Crow | 99.0 /100 | #85 | Exceptional 94.7% |
| Puget Sound Salish | 99.0 /100 | #86 | Exceptional 94.7% |
| Immigrants | Saudi Arabia | 99.0 /100 | #87 | Exceptional 94.7% |
| Immigrants | Japan | 99.0 /100 | #88 | Exceptional 94.7% |
| Immigrants | Moldova | 98.9 /100 | #89 | Exceptional 94.7% |
| South Africans | 98.8 /100 | #90 | Exceptional 94.7% |
| Whites/Caucasians | 98.8 /100 | #91 | Exceptional 94.7% |
| Yugoslavians | 98.4 /100 | #92 | Exceptional 94.6% |
| Soviet Union | 98.3 /100 | #93 | Exceptional 94.6% |
| Immigrants | Germany | 98.3 /100 | #94 | Exceptional 94.6% |