Swiss vs Immigrants from Hong Kong 10th Grade
COMPARE
Swiss
Immigrants from Hong Kong
10th Grade
10th Grade Comparison
Swiss
Immigrants from Hong Kong
94.7%
10TH GRADE
99.1/ 100
METRIC RATING
82nd/ 347
METRIC RANK
93.1%
10TH GRADE
4.2/ 100
METRIC RATING
240th/ 347
METRIC RANK
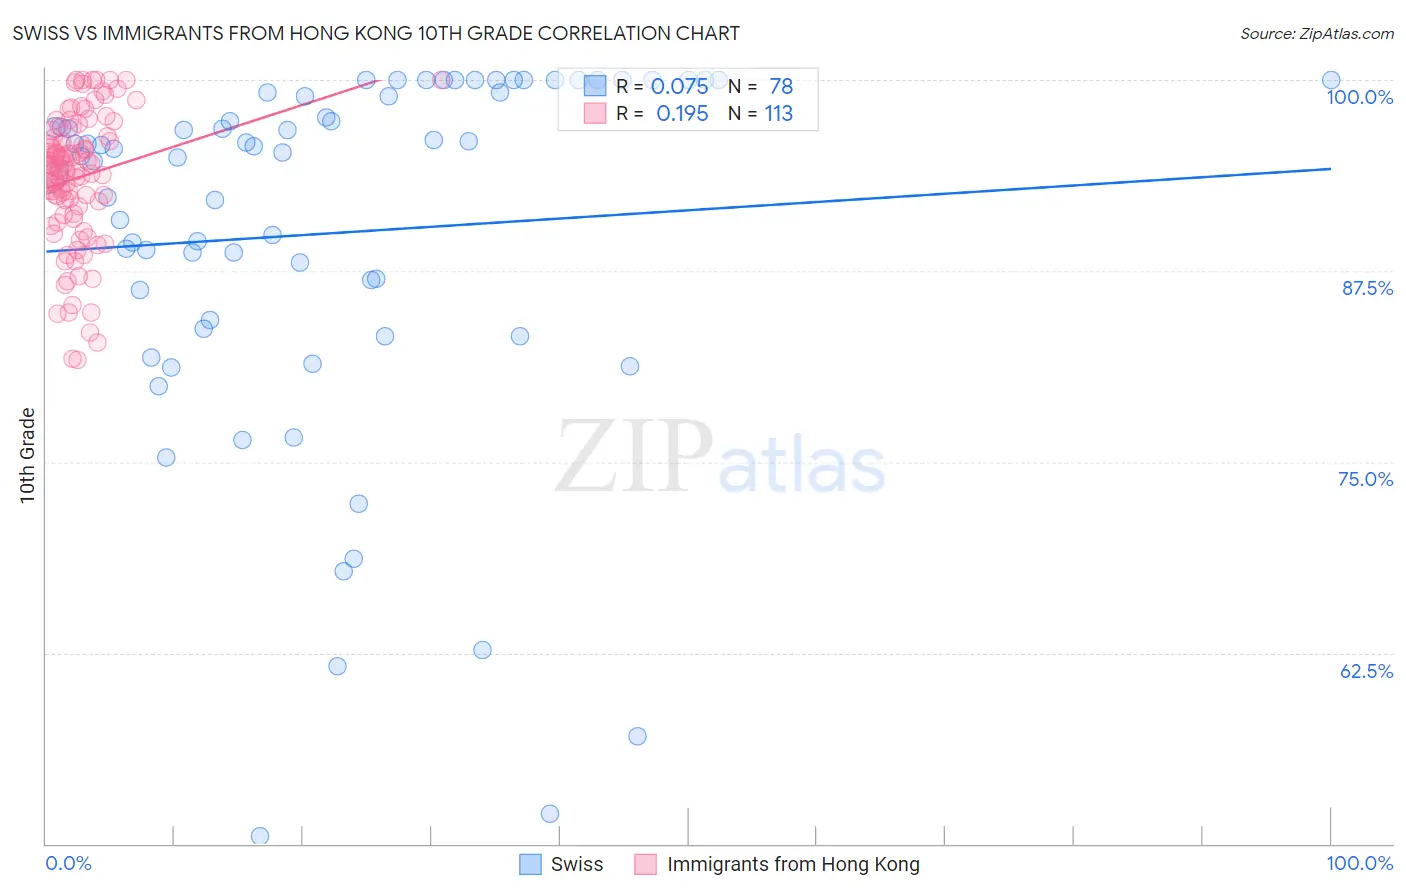
Swiss vs Immigrants from Hong Kong 10th Grade Correlation Chart
The statistical analysis conducted on geographies consisting of 465,022,572 people shows a slight positive correlation between the proportion of Swiss and percentage of population with at least 10th grade education in the United States with a correlation coefficient (R) of 0.075 and weighted average of 94.7%. Similarly, the statistical analysis conducted on geographies consisting of 253,990,382 people shows a poor positive correlation between the proportion of Immigrants from Hong Kong and percentage of population with at least 10th grade education in the United States with a correlation coefficient (R) of 0.195 and weighted average of 93.1%, a difference of 1.8%.
10th Grade Correlation Summary
| Measurement | Swiss | Immigrants from Hong Kong |
| Minimum | 50.5% | 81.7% |
| Maximum | 100.0% | 100.0% |
| Range | 49.5% | 18.3% |
| Mean | 90.0% | 93.6% |
| Median | 95.4% | 94.2% |
| Interquartile 25% (IQ1) | 84.3% | 91.5% |
| Interquartile 75% (IQ3) | 99.2% | 96.3% |
| Interquartile Range (IQR) | 14.9% | 4.8% |
| Standard Deviation (Sample) | 12.0% | 4.3% |
| Standard Deviation (Population) | 11.9% | 4.3% |
Similar Demographics by 10th Grade
Demographics Similar to Swiss by 10th Grade
In terms of 10th grade, the demographic groups most similar to Swiss are Immigrants from Western Europe (94.7%, a difference of 0.010%), Icelander (94.7%, a difference of 0.010%), Crow (94.7%, a difference of 0.020%), Puget Sound Salish (94.7%, a difference of 0.020%), and Immigrants from Denmark (94.7%, a difference of 0.030%).
| Demographics | Rating | Rank | 10th Grade |
| Okinawans | 99.5 /100 | #75 | Exceptional 94.8% |
| Romanians | 99.5 /100 | #76 | Exceptional 94.8% |
| Immigrants | South Africa | 99.5 /100 | #77 | Exceptional 94.8% |
| Filipinos | 99.3 /100 | #78 | Exceptional 94.8% |
| Immigrants | Czechoslovakia | 99.2 /100 | #79 | Exceptional 94.7% |
| Immigrants | Denmark | 99.2 /100 | #80 | Exceptional 94.7% |
| Immigrants | Latvia | 99.2 /100 | #81 | Exceptional 94.7% |
| Swiss | 99.1 /100 | #82 | Exceptional 94.7% |
| Immigrants | Western Europe | 99.1 /100 | #83 | Exceptional 94.7% |
| Icelanders | 99.1 /100 | #84 | Exceptional 94.7% |
| Crow | 99.0 /100 | #85 | Exceptional 94.7% |
| Puget Sound Salish | 99.0 /100 | #86 | Exceptional 94.7% |
| Immigrants | Saudi Arabia | 99.0 /100 | #87 | Exceptional 94.7% |
| Immigrants | Japan | 99.0 /100 | #88 | Exceptional 94.7% |
| Immigrants | Moldova | 98.9 /100 | #89 | Exceptional 94.7% |
Demographics Similar to Immigrants from Hong Kong by 10th Grade
In terms of 10th grade, the demographic groups most similar to Immigrants from Hong Kong are Nigerian (93.1%, a difference of 0.0%), Costa Rican (93.1%, a difference of 0.0%), Immigrants from Panama (93.1%, a difference of 0.010%), African (93.1%, a difference of 0.020%), and Afghan (93.1%, a difference of 0.020%).
| Demographics | Rating | Rank | 10th Grade |
| Comanche | 4.9 /100 | #233 | Tragic 93.1% |
| Sub-Saharan Africans | 4.7 /100 | #234 | Tragic 93.1% |
| Africans | 4.6 /100 | #235 | Tragic 93.1% |
| Afghans | 4.5 /100 | #236 | Tragic 93.1% |
| Immigrants | Panama | 4.3 /100 | #237 | Tragic 93.1% |
| Nigerians | 4.2 /100 | #238 | Tragic 93.1% |
| Costa Ricans | 4.2 /100 | #239 | Tragic 93.1% |
| Immigrants | Hong Kong | 4.2 /100 | #240 | Tragic 93.1% |
| Immigrants | Somalia | 2.7 /100 | #241 | Tragic 93.0% |
| Immigrants | Cameroon | 2.6 /100 | #242 | Tragic 93.0% |
| Senegalese | 2.4 /100 | #243 | Tragic 93.0% |
| Spanish Americans | 2.1 /100 | #244 | Tragic 92.9% |
| Uruguayans | 1.8 /100 | #245 | Tragic 92.9% |
| Immigrants | Middle Africa | 1.7 /100 | #246 | Tragic 92.9% |
| Immigrants | Afghanistan | 1.4 /100 | #247 | Tragic 92.8% |