Venezuelan vs Immigrants from Hong Kong 10th Grade
COMPARE
Venezuelan
Immigrants from Hong Kong
10th Grade
10th Grade Comparison
Venezuelans
Immigrants from Hong Kong
93.9%
10TH GRADE
69.5/ 100
METRIC RATING
163rd/ 347
METRIC RANK
93.1%
10TH GRADE
4.2/ 100
METRIC RATING
240th/ 347
METRIC RANK
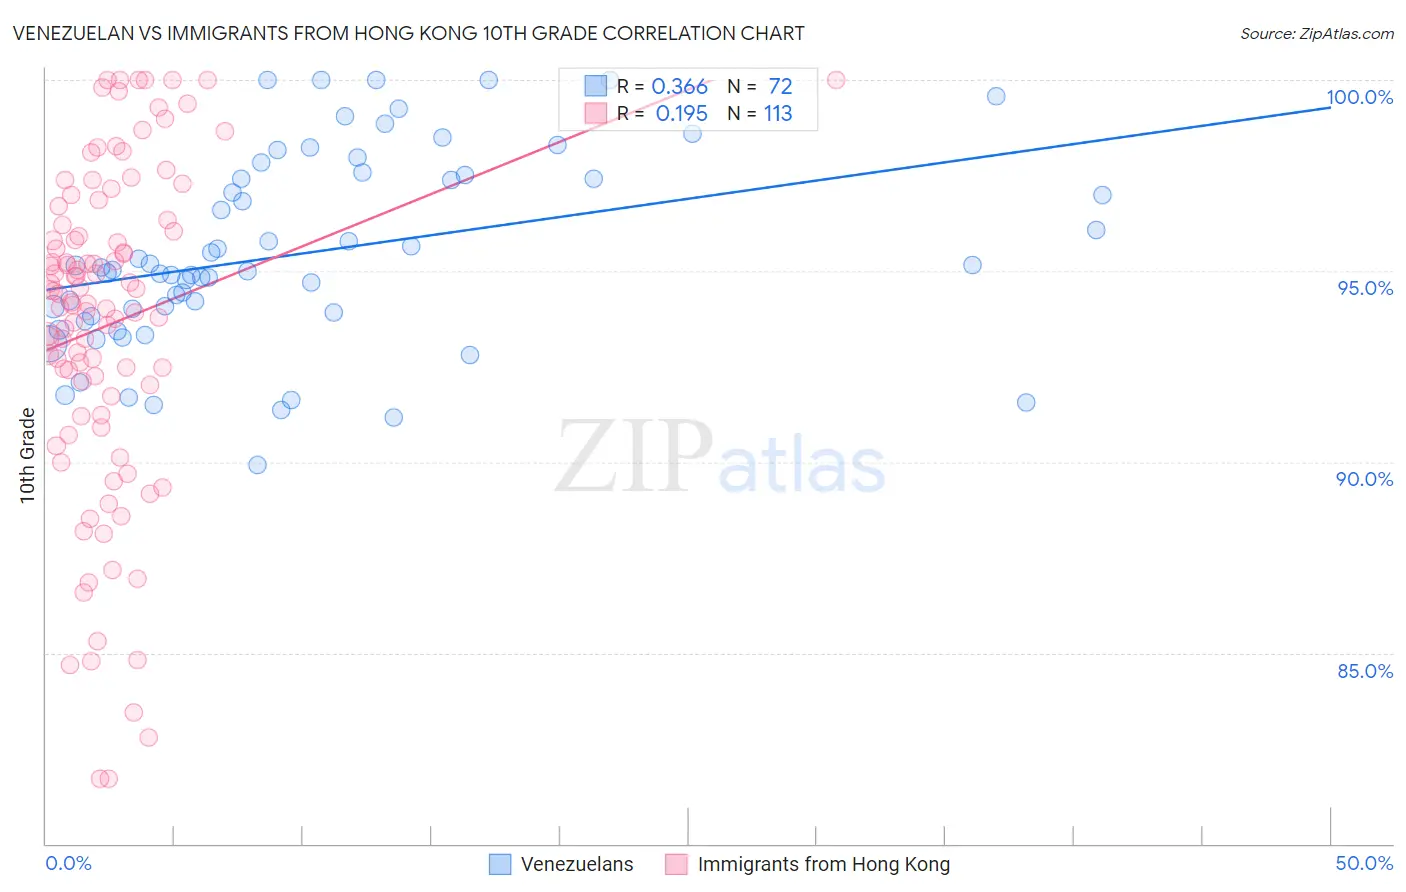
Venezuelan vs Immigrants from Hong Kong 10th Grade Correlation Chart
The statistical analysis conducted on geographies consisting of 306,323,887 people shows a mild positive correlation between the proportion of Venezuelans and percentage of population with at least 10th grade education in the United States with a correlation coefficient (R) of 0.366 and weighted average of 93.9%. Similarly, the statistical analysis conducted on geographies consisting of 253,990,382 people shows a poor positive correlation between the proportion of Immigrants from Hong Kong and percentage of population with at least 10th grade education in the United States with a correlation coefficient (R) of 0.195 and weighted average of 93.1%, a difference of 0.89%.
10th Grade Correlation Summary
| Measurement | Venezuelan | Immigrants from Hong Kong |
| Minimum | 89.9% | 81.7% |
| Maximum | 100.0% | 100.0% |
| Range | 10.1% | 18.3% |
| Mean | 95.5% | 93.6% |
| Median | 95.0% | 94.2% |
| Interquartile 25% (IQ1) | 93.9% | 91.5% |
| Interquartile 75% (IQ3) | 97.5% | 96.3% |
| Interquartile Range (IQR) | 3.6% | 4.8% |
| Standard Deviation (Sample) | 2.5% | 4.3% |
| Standard Deviation (Population) | 2.5% | 4.3% |
Similar Demographics by 10th Grade
Demographics Similar to Venezuelans by 10th Grade
In terms of 10th grade, the demographic groups most similar to Venezuelans are Assyrian/Chaldean/Syriac (93.9%, a difference of 0.0%), Immigrants from Poland (93.9%, a difference of 0.0%), Chilean (93.9%, a difference of 0.010%), Pakistani (93.9%, a difference of 0.010%), and Iraqi (93.9%, a difference of 0.010%).
| Demographics | Rating | Rank | 10th Grade |
| Mongolians | 74.4 /100 | #156 | Good 94.0% |
| Kiowa | 73.3 /100 | #157 | Good 93.9% |
| Bermudans | 71.0 /100 | #158 | Good 93.9% |
| Chileans | 70.2 /100 | #159 | Good 93.9% |
| Pakistanis | 70.1 /100 | #160 | Good 93.9% |
| Assyrians/Chaldeans/Syriacs | 69.7 /100 | #161 | Good 93.9% |
| Immigrants | Poland | 69.6 /100 | #162 | Good 93.9% |
| Venezuelans | 69.5 /100 | #163 | Good 93.9% |
| Iraqis | 68.1 /100 | #164 | Good 93.9% |
| Brazilians | 63.6 /100 | #165 | Good 93.8% |
| Immigrants | Iraq | 63.0 /100 | #166 | Good 93.8% |
| Immigrants | Egypt | 62.3 /100 | #167 | Good 93.8% |
| Alsatians | 59.4 /100 | #168 | Average 93.8% |
| Immigrants | Spain | 55.9 /100 | #169 | Average 93.8% |
| Immigrants | Venezuela | 53.9 /100 | #170 | Average 93.8% |
Demographics Similar to Immigrants from Hong Kong by 10th Grade
In terms of 10th grade, the demographic groups most similar to Immigrants from Hong Kong are Nigerian (93.1%, a difference of 0.0%), Costa Rican (93.1%, a difference of 0.0%), Immigrants from Panama (93.1%, a difference of 0.010%), African (93.1%, a difference of 0.020%), and Afghan (93.1%, a difference of 0.020%).
| Demographics | Rating | Rank | 10th Grade |
| Comanche | 4.9 /100 | #233 | Tragic 93.1% |
| Sub-Saharan Africans | 4.7 /100 | #234 | Tragic 93.1% |
| Africans | 4.6 /100 | #235 | Tragic 93.1% |
| Afghans | 4.5 /100 | #236 | Tragic 93.1% |
| Immigrants | Panama | 4.3 /100 | #237 | Tragic 93.1% |
| Nigerians | 4.2 /100 | #238 | Tragic 93.1% |
| Costa Ricans | 4.2 /100 | #239 | Tragic 93.1% |
| Immigrants | Hong Kong | 4.2 /100 | #240 | Tragic 93.1% |
| Immigrants | Somalia | 2.7 /100 | #241 | Tragic 93.0% |
| Immigrants | Cameroon | 2.6 /100 | #242 | Tragic 93.0% |
| Senegalese | 2.4 /100 | #243 | Tragic 93.0% |
| Spanish Americans | 2.1 /100 | #244 | Tragic 92.9% |
| Uruguayans | 1.8 /100 | #245 | Tragic 92.9% |
| Immigrants | Middle Africa | 1.7 /100 | #246 | Tragic 92.9% |
| Immigrants | Afghanistan | 1.4 /100 | #247 | Tragic 92.8% |