Tohono O'odham vs Immigrants from China GED/Equivalency
COMPARE
Tohono O'odham
Immigrants from China
GED/Equivalency
GED/Equivalency Comparison
Tohono O'odham
Immigrants from China
77.5%
GED/EQUIVALENCY
0.0/ 100
METRIC RATING
340th/ 347
METRIC RANK
86.9%
GED/EQUIVALENCY
93.2/ 100
METRIC RATING
119th/ 347
METRIC RANK
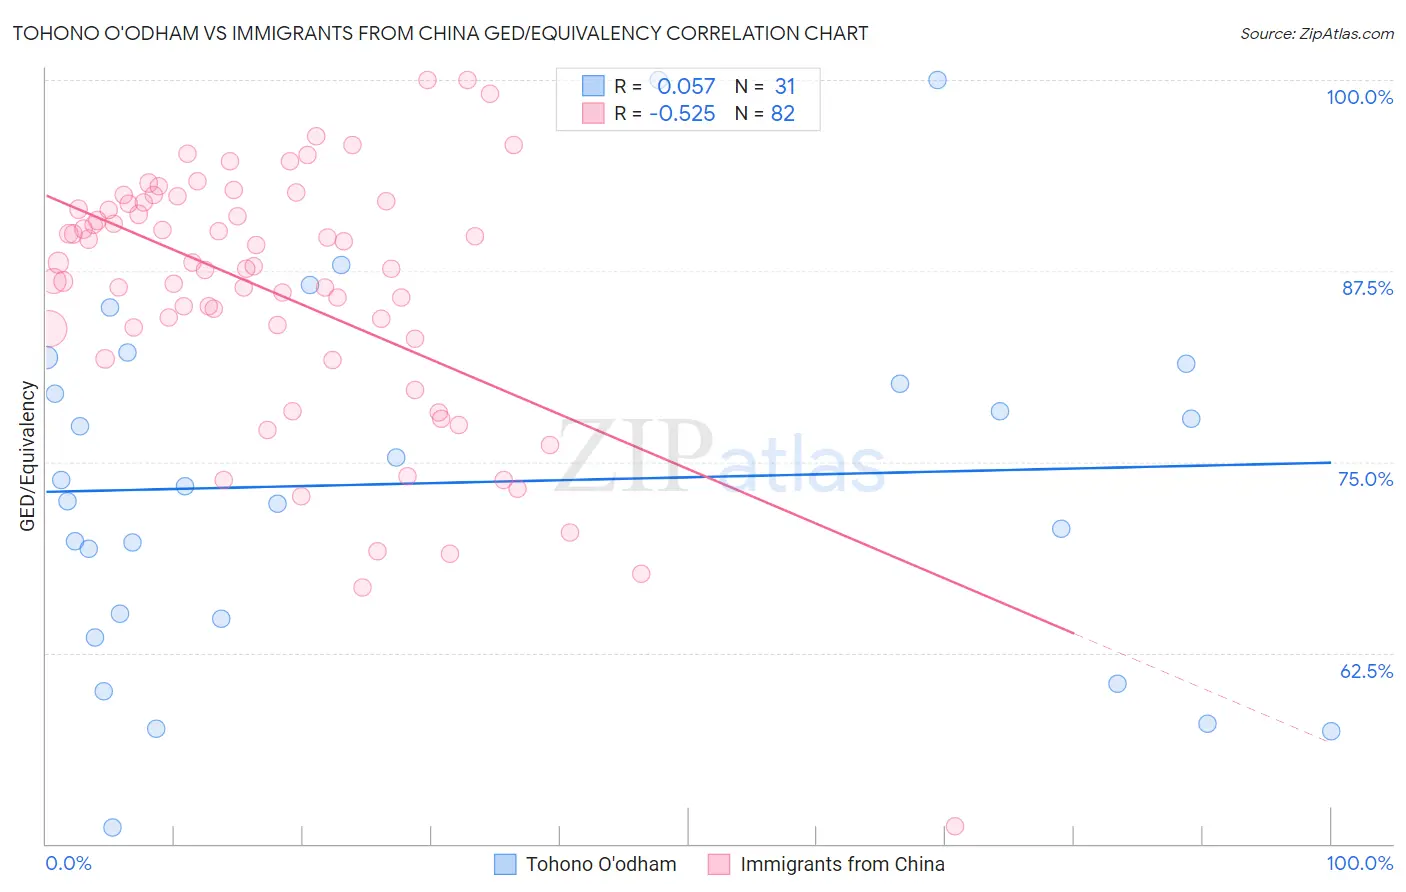
Tohono O'odham vs Immigrants from China GED/Equivalency Correlation Chart
The statistical analysis conducted on geographies consisting of 58,730,525 people shows a slight positive correlation between the proportion of Tohono O'odham and percentage of population with at least ged/equivalency education in the United States with a correlation coefficient (R) of 0.057 and weighted average of 77.5%. Similarly, the statistical analysis conducted on geographies consisting of 457,082,738 people shows a substantial negative correlation between the proportion of Immigrants from China and percentage of population with at least ged/equivalency education in the United States with a correlation coefficient (R) of -0.525 and weighted average of 86.9%, a difference of 12.1%.
GED/Equivalency Correlation Summary
| Measurement | Tohono O'odham | Immigrants from China |
| Minimum | 51.1% | 51.2% |
| Maximum | 100.0% | 100.0% |
| Range | 48.9% | 48.8% |
| Mean | 73.6% | 86.0% |
| Median | 73.4% | 87.7% |
| Interquartile 25% (IQ1) | 64.7% | 83.1% |
| Interquartile 75% (IQ3) | 81.4% | 91.9% |
| Interquartile Range (IQR) | 16.7% | 8.8% |
| Standard Deviation (Sample) | 11.8% | 8.6% |
| Standard Deviation (Population) | 11.6% | 8.6% |
Similar Demographics by GED/Equivalency
Demographics Similar to Tohono O'odham by GED/Equivalency
In terms of ged/equivalency, the demographic groups most similar to Tohono O'odham are Mexican (77.4%, a difference of 0.090%), Immigrants from El Salvador (77.6%, a difference of 0.16%), Immigrants from Guatemala (77.9%, a difference of 0.54%), Immigrants from Yemen (77.9%, a difference of 0.56%), and Immigrants from Dominican Republic (78.0%, a difference of 0.63%).
| Demographics | Rating | Rank | GED/Equivalency |
| Salvadorans | 0.0 /100 | #333 | Tragic 78.6% |
| Guatemalans | 0.0 /100 | #334 | Tragic 78.5% |
| Immigrants | Latin America | 0.0 /100 | #335 | Tragic 78.5% |
| Immigrants | Dominican Republic | 0.0 /100 | #336 | Tragic 78.0% |
| Immigrants | Yemen | 0.0 /100 | #337 | Tragic 77.9% |
| Immigrants | Guatemala | 0.0 /100 | #338 | Tragic 77.9% |
| Immigrants | El Salvador | 0.0 /100 | #339 | Tragic 77.6% |
| Tohono O'odham | 0.0 /100 | #340 | Tragic 77.5% |
| Mexicans | 0.0 /100 | #341 | Tragic 77.4% |
| Pima | 0.0 /100 | #342 | Tragic 76.4% |
| Immigrants | Central America | 0.0 /100 | #343 | Tragic 76.4% |
| Spanish American Indians | 0.0 /100 | #344 | Tragic 76.3% |
| Immigrants | Mexico | 0.0 /100 | #345 | Tragic 75.7% |
| Houma | 0.0 /100 | #346 | Tragic 75.0% |
| Yakama | 0.0 /100 | #347 | Tragic 74.5% |
Demographics Similar to Immigrants from China by GED/Equivalency
In terms of ged/equivalency, the demographic groups most similar to Immigrants from China are French Canadian (86.9%, a difference of 0.0%), Immigrants from Hong Kong (86.9%, a difference of 0.050%), Swiss (87.0%, a difference of 0.12%), Scotch-Irish (86.8%, a difference of 0.12%), and Immigrants from Kazakhstan (87.0%, a difference of 0.13%).
| Demographics | Rating | Rank | GED/Equivalency |
| Tlingit-Haida | 94.8 /100 | #112 | Exceptional 87.0% |
| Assyrians/Chaldeans/Syriacs | 94.8 /100 | #113 | Exceptional 87.0% |
| Immigrants | Kazakhstan | 94.7 /100 | #114 | Exceptional 87.0% |
| Mongolians | 94.6 /100 | #115 | Exceptional 87.0% |
| Swiss | 94.5 /100 | #116 | Exceptional 87.0% |
| Immigrants | Hong Kong | 93.8 /100 | #117 | Exceptional 86.9% |
| French Canadians | 93.2 /100 | #118 | Exceptional 86.9% |
| Immigrants | China | 93.2 /100 | #119 | Exceptional 86.9% |
| Scotch-Irish | 91.6 /100 | #120 | Exceptional 86.8% |
| Immigrants | Lebanon | 90.9 /100 | #121 | Exceptional 86.8% |
| Immigrants | Jordan | 90.8 /100 | #122 | Exceptional 86.8% |
| Immigrants | Italy | 90.5 /100 | #123 | Exceptional 86.7% |
| Immigrants | Egypt | 90.4 /100 | #124 | Exceptional 86.7% |
| Celtics | 90.4 /100 | #125 | Exceptional 86.7% |
| Asians | 90.3 /100 | #126 | Exceptional 86.7% |