Blackfeet vs Immigrants from China Disability Age Over 75
COMPARE
Blackfeet
Immigrants from China
Disability Age Over 75
Disability Age Over 75 Comparison
Blackfeet
Immigrants from China
48.8%
DISABILITY AGE OVER 75
0.5/ 100
METRIC RATING
257th/ 347
METRIC RANK
46.3%
DISABILITY AGE OVER 75
98.0/ 100
METRIC RATING
96th/ 347
METRIC RANK
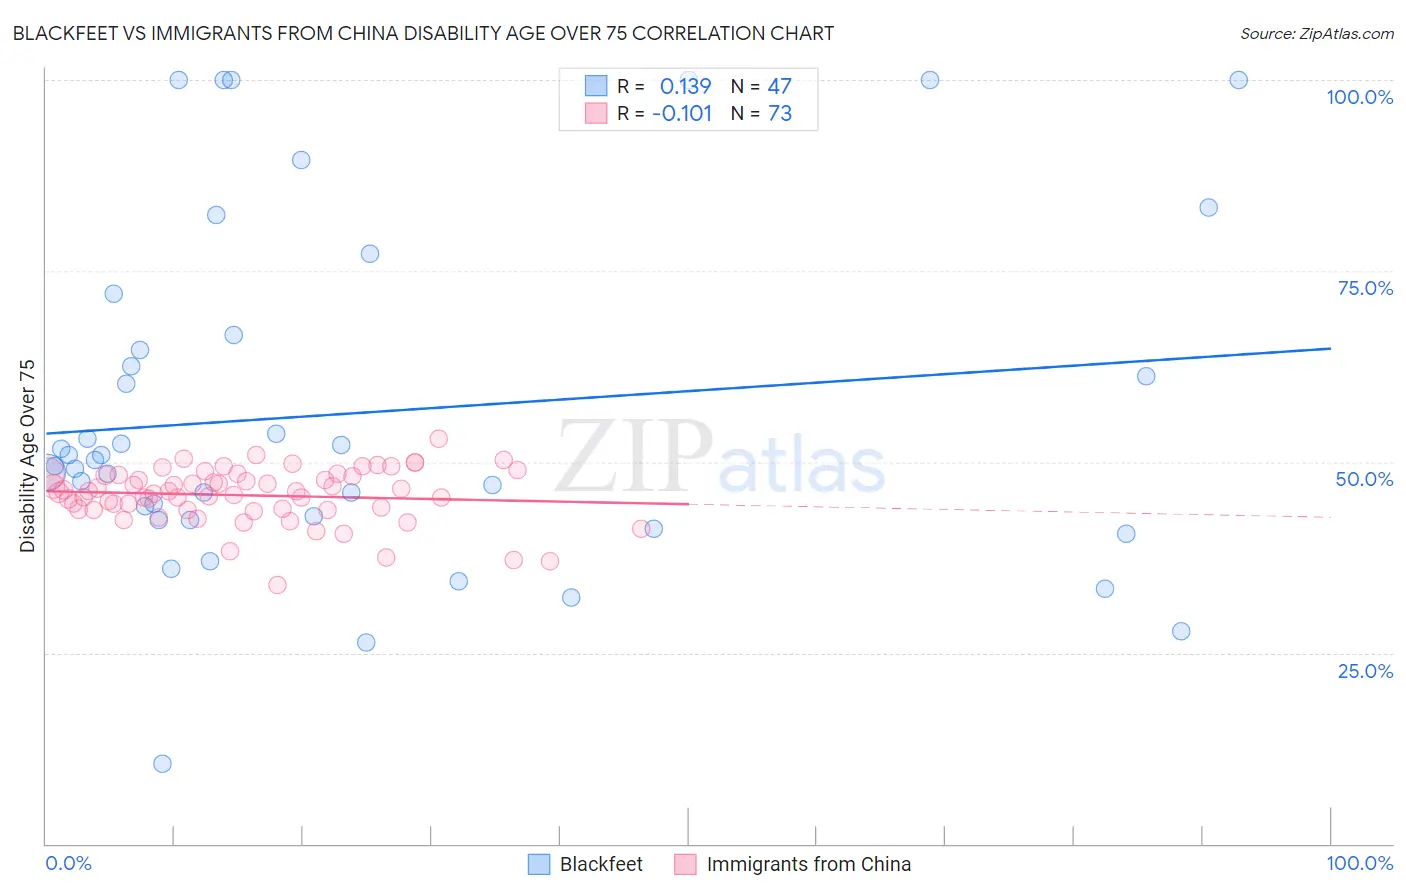
Blackfeet vs Immigrants from China Disability Age Over 75 Correlation Chart
The statistical analysis conducted on geographies consisting of 309,061,440 people shows a poor positive correlation between the proportion of Blackfeet and percentage of population with a disability over the age of 75 in the United States with a correlation coefficient (R) of 0.139 and weighted average of 48.8%. Similarly, the statistical analysis conducted on geographies consisting of 455,855,137 people shows a poor negative correlation between the proportion of Immigrants from China and percentage of population with a disability over the age of 75 in the United States with a correlation coefficient (R) of -0.101 and weighted average of 46.3%, a difference of 5.3%.
Disability Age Over 75 Correlation Summary
| Measurement | Blackfeet | Immigrants from China |
| Minimum | 10.4% | 33.8% |
| Maximum | 100.0% | 53.1% |
| Range | 89.6% | 19.3% |
| Mean | 56.4% | 45.6% |
| Median | 50.3% | 46.2% |
| Interquartile 25% (IQ1) | 42.5% | 43.8% |
| Interquartile 75% (IQ3) | 66.7% | 48.3% |
| Interquartile Range (IQR) | 24.2% | 4.5% |
| Standard Deviation (Sample) | 22.5% | 3.6% |
| Standard Deviation (Population) | 22.2% | 3.5% |
Similar Demographics by Disability Age Over 75
Demographics Similar to Blackfeet by Disability Age Over 75
In terms of disability age over 75, the demographic groups most similar to Blackfeet are Immigrants from Philippines (48.8%, a difference of 0.040%), Immigrants from Congo (48.7%, a difference of 0.050%), Chinese (48.7%, a difference of 0.060%), Immigrants from Vietnam (48.7%, a difference of 0.10%), and Central American (48.8%, a difference of 0.11%).
| Demographics | Rating | Rank | Disability Age Over 75 |
| West Indians | 0.8 /100 | #250 | Tragic 48.6% |
| Koreans | 0.8 /100 | #251 | Tragic 48.6% |
| Immigrants | South Eastern Asia | 0.7 /100 | #252 | Tragic 48.7% |
| British West Indians | 0.6 /100 | #253 | Tragic 48.7% |
| Immigrants | Vietnam | 0.6 /100 | #254 | Tragic 48.7% |
| Chinese | 0.5 /100 | #255 | Tragic 48.7% |
| Immigrants | Congo | 0.5 /100 | #256 | Tragic 48.7% |
| Blackfeet | 0.5 /100 | #257 | Tragic 48.8% |
| Immigrants | Philippines | 0.4 /100 | #258 | Tragic 48.8% |
| Central Americans | 0.4 /100 | #259 | Tragic 48.8% |
| Immigrants | Afghanistan | 0.4 /100 | #260 | Tragic 48.8% |
| Africans | 0.3 /100 | #261 | Tragic 48.9% |
| Immigrants | West Indies | 0.3 /100 | #262 | Tragic 48.9% |
| Salvadorans | 0.3 /100 | #263 | Tragic 48.9% |
| Immigrants | Honduras | 0.3 /100 | #264 | Tragic 48.9% |
Demographics Similar to Immigrants from China by Disability Age Over 75
In terms of disability age over 75, the demographic groups most similar to Immigrants from China are Immigrants from Brazil (46.3%, a difference of 0.010%), Finnish (46.3%, a difference of 0.020%), Albanian (46.3%, a difference of 0.030%), Immigrants from Japan (46.3%, a difference of 0.030%), and Ugandan (46.3%, a difference of 0.060%).
| Demographics | Rating | Rank | Disability Age Over 75 |
| Immigrants | Saudi Arabia | 98.4 /100 | #89 | Exceptional 46.3% |
| Northern Europeans | 98.3 /100 | #90 | Exceptional 46.3% |
| Immigrants | Egypt | 98.3 /100 | #91 | Exceptional 46.3% |
| Germans | 98.2 /100 | #92 | Exceptional 46.3% |
| Ugandans | 98.2 /100 | #93 | Exceptional 46.3% |
| Albanians | 98.1 /100 | #94 | Exceptional 46.3% |
| Immigrants | Brazil | 98.0 /100 | #95 | Exceptional 46.3% |
| Immigrants | China | 98.0 /100 | #96 | Exceptional 46.3% |
| Finns | 97.9 /100 | #97 | Exceptional 46.3% |
| Immigrants | Japan | 97.8 /100 | #98 | Exceptional 46.3% |
| Palestinians | 97.7 /100 | #99 | Exceptional 46.3% |
| Immigrants | Eastern Europe | 97.7 /100 | #100 | Exceptional 46.3% |
| Mongolians | 97.7 /100 | #101 | Exceptional 46.3% |
| Immigrants | Malaysia | 97.1 /100 | #102 | Exceptional 46.4% |
| Ukrainians | 97.1 /100 | #103 | Exceptional 46.4% |