Belizean vs Immigrants from Saudi Arabia Professional Degree
COMPARE
Belizean
Immigrants from Saudi Arabia
Professional Degree
Professional Degree Comparison
Belizeans
Immigrants from Saudi Arabia
3.6%
PROFESSIONAL DEGREE
0.5/ 100
METRIC RATING
271st/ 347
METRIC RANK
5.9%
PROFESSIONAL DEGREE
100.0/ 100
METRIC RATING
43rd/ 347
METRIC RANK
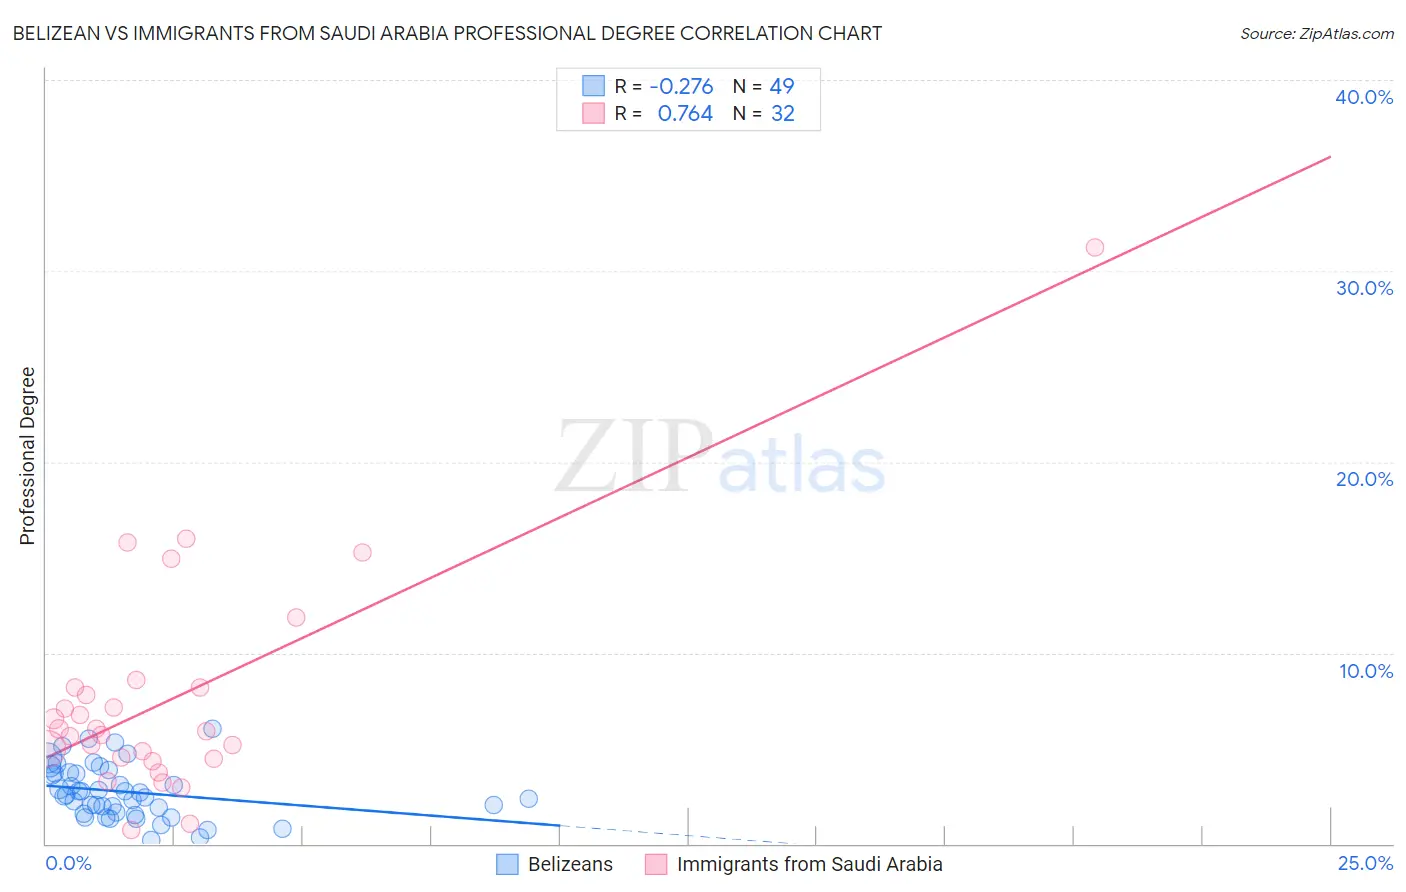
Belizean vs Immigrants from Saudi Arabia Professional Degree Correlation Chart
The statistical analysis conducted on geographies consisting of 144,093,720 people shows a weak negative correlation between the proportion of Belizeans and percentage of population with at least professional degree education in the United States with a correlation coefficient (R) of -0.276 and weighted average of 3.6%. Similarly, the statistical analysis conducted on geographies consisting of 164,208,779 people shows a strong positive correlation between the proportion of Immigrants from Saudi Arabia and percentage of population with at least professional degree education in the United States with a correlation coefficient (R) of 0.764 and weighted average of 5.9%, a difference of 66.3%.
Professional Degree Correlation Summary
| Measurement | Belizean | Immigrants from Saudi Arabia |
| Minimum | 0.21% | 0.70% |
| Maximum | 6.0% | 31.2% |
| Range | 5.8% | 30.5% |
| Mean | 2.7% | 7.6% |
| Median | 2.5% | 5.9% |
| Interquartile 25% (IQ1) | 1.6% | 4.5% |
| Interquartile 75% (IQ3) | 3.7% | 8.2% |
| Interquartile Range (IQR) | 2.1% | 3.7% |
| Standard Deviation (Sample) | 1.4% | 5.9% |
| Standard Deviation (Population) | 1.4% | 5.8% |
Similar Demographics by Professional Degree
Demographics Similar to Belizeans by Professional Degree
In terms of professional degree, the demographic groups most similar to Belizeans are Immigrants from Jamaica (3.6%, a difference of 0.030%), American (3.6%, a difference of 0.090%), Potawatomi (3.6%, a difference of 0.22%), Immigrants from Dominica (3.6%, a difference of 0.45%), and Central American (3.6%, a difference of 0.47%).
| Demographics | Rating | Rank | Professional Degree |
| Immigrants | Cambodia | 0.9 /100 | #264 | Tragic 3.6% |
| Immigrants | Congo | 0.8 /100 | #265 | Tragic 3.6% |
| Central American Indians | 0.8 /100 | #266 | Tragic 3.6% |
| Delaware | 0.7 /100 | #267 | Tragic 3.6% |
| Aleuts | 0.7 /100 | #268 | Tragic 3.6% |
| Immigrants | Cuba | 0.6 /100 | #269 | Tragic 3.6% |
| Central Americans | 0.6 /100 | #270 | Tragic 3.6% |
| Belizeans | 0.5 /100 | #271 | Tragic 3.6% |
| Immigrants | Jamaica | 0.5 /100 | #272 | Tragic 3.6% |
| Americans | 0.5 /100 | #273 | Tragic 3.6% |
| Potawatomi | 0.5 /100 | #274 | Tragic 3.6% |
| Immigrants | Dominica | 0.5 /100 | #275 | Tragic 3.6% |
| Liberians | 0.5 /100 | #276 | Tragic 3.6% |
| Cheyenne | 0.5 /100 | #277 | Tragic 3.6% |
| Japanese | 0.5 /100 | #278 | Tragic 3.5% |
Demographics Similar to Immigrants from Saudi Arabia by Professional Degree
In terms of professional degree, the demographic groups most similar to Immigrants from Saudi Arabia are Argentinean (5.9%, a difference of 0.16%), Estonian (6.0%, a difference of 0.32%), New Zealander (6.0%, a difference of 0.33%), Cambodian (6.0%, a difference of 0.52%), and Immigrants from South Central Asia (5.9%, a difference of 0.61%).
| Demographics | Rating | Rank | Professional Degree |
| Immigrants | Russia | 100.0 /100 | #36 | Exceptional 6.0% |
| Immigrants | Austria | 100.0 /100 | #37 | Exceptional 6.0% |
| Immigrants | Norway | 100.0 /100 | #38 | Exceptional 6.0% |
| Immigrants | South Africa | 100.0 /100 | #39 | Exceptional 6.0% |
| Cambodians | 100.0 /100 | #40 | Exceptional 6.0% |
| New Zealanders | 100.0 /100 | #41 | Exceptional 6.0% |
| Estonians | 100.0 /100 | #42 | Exceptional 6.0% |
| Immigrants | Saudi Arabia | 100.0 /100 | #43 | Exceptional 5.9% |
| Argentineans | 100.0 /100 | #44 | Exceptional 5.9% |
| Immigrants | South Central Asia | 100.0 /100 | #45 | Exceptional 5.9% |
| Immigrants | Argentina | 100.0 /100 | #46 | Exceptional 5.9% |
| Australians | 100.0 /100 | #47 | Exceptional 5.9% |
| Paraguayans | 100.0 /100 | #48 | Exceptional 5.9% |
| Immigrants | Latvia | 100.0 /100 | #49 | Exceptional 5.8% |
| Immigrants | Czechoslovakia | 100.0 /100 | #50 | Exceptional 5.8% |