Belizean vs Immigrants from Hungary College, 1 year or more
COMPARE
Belizean
Immigrants from Hungary
College, 1 year or more
College, 1 year or more Comparison
Belizeans
Immigrants from Hungary
54.4%
COLLEGE, 1 YEAR OR MORE
0.2/ 100
METRIC RATING
274th/ 347
METRIC RANK
62.7%
COLLEGE, 1 YEAR OR MORE
98.6/ 100
METRIC RATING
87th/ 347
METRIC RANK
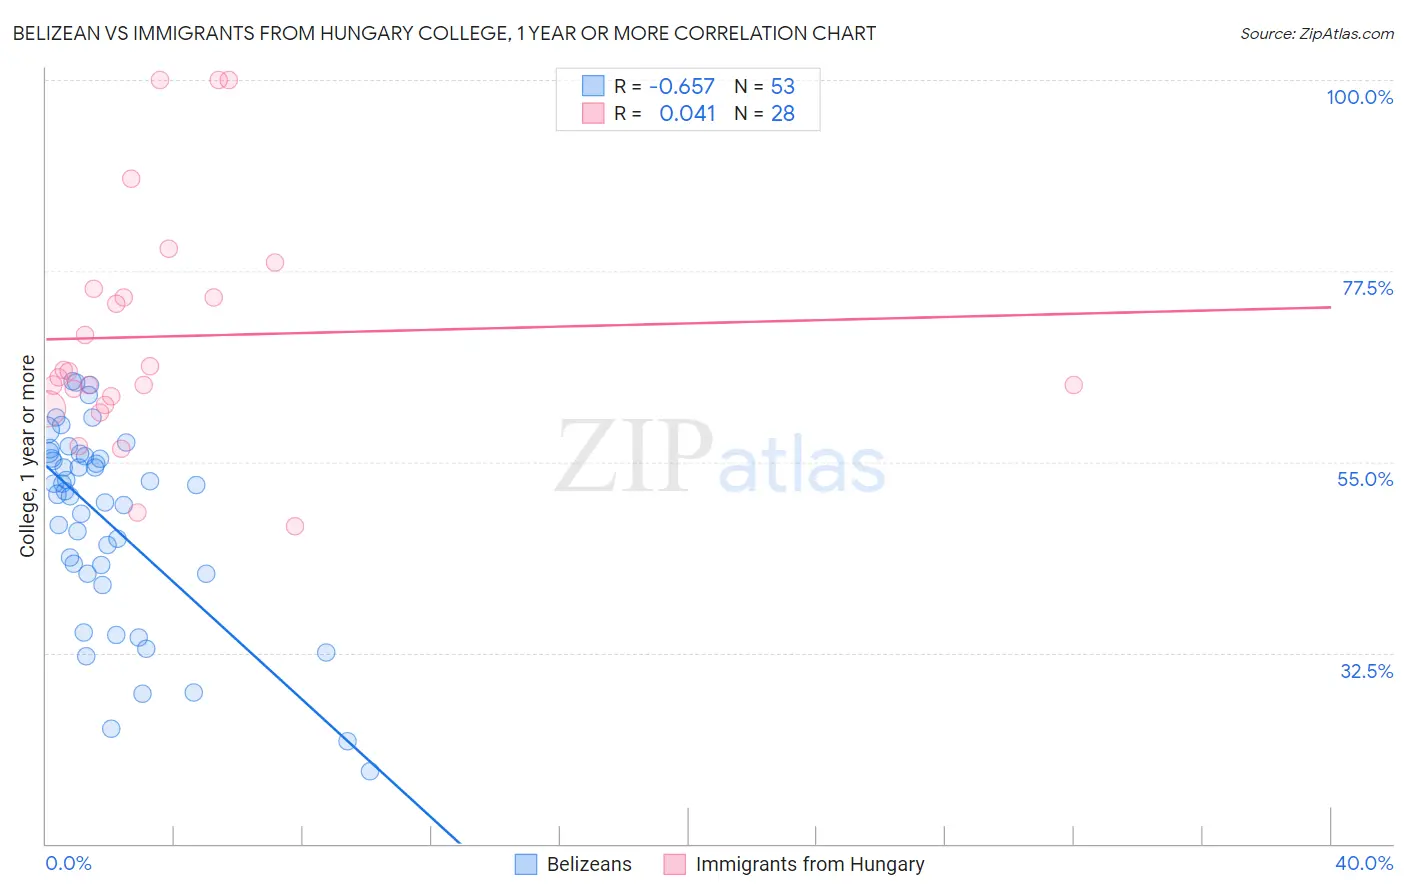
Belizean vs Immigrants from Hungary College, 1 year or more Correlation Chart
The statistical analysis conducted on geographies consisting of 144,224,111 people shows a significant negative correlation between the proportion of Belizeans and percentage of population with at least college, 1 year or more education in the United States with a correlation coefficient (R) of -0.657 and weighted average of 54.4%. Similarly, the statistical analysis conducted on geographies consisting of 195,707,305 people shows no correlation between the proportion of Immigrants from Hungary and percentage of population with at least college, 1 year or more education in the United States with a correlation coefficient (R) of 0.041 and weighted average of 62.7%, a difference of 15.3%.
College, 1 year or more Correlation Summary
| Measurement | Belizean | Immigrants from Hungary |
| Minimum | 18.5% | 47.4% |
| Maximum | 64.4% | 100.0% |
| Range | 45.9% | 52.6% |
| Mean | 48.0% | 69.8% |
| Median | 51.6% | 65.3% |
| Interquartile 25% (IQ1) | 41.8% | 62.2% |
| Interquartile 75% (IQ3) | 55.8% | 74.9% |
| Interquartile Range (IQR) | 14.0% | 12.7% |
| Standard Deviation (Sample) | 11.5% | 13.8% |
| Standard Deviation (Population) | 11.4% | 13.5% |
Similar Demographics by College, 1 year or more
Demographics Similar to Belizeans by College, 1 year or more
In terms of college, 1 year or more, the demographic groups most similar to Belizeans are American (54.4%, a difference of 0.020%), Immigrants from Grenada (54.4%, a difference of 0.040%), Comanche (54.4%, a difference of 0.080%), Shoshone (54.3%, a difference of 0.11%), and Bahamian (54.5%, a difference of 0.12%).
| Demographics | Rating | Rank | College, 1 year or more |
| Blackfeet | 0.2 /100 | #267 | Tragic 54.6% |
| British West Indians | 0.2 /100 | #268 | Tragic 54.5% |
| Bangladeshis | 0.2 /100 | #269 | Tragic 54.5% |
| Crow | 0.2 /100 | #270 | Tragic 54.5% |
| Bahamians | 0.2 /100 | #271 | Tragic 54.5% |
| Comanche | 0.2 /100 | #272 | Tragic 54.4% |
| Immigrants | Grenada | 0.2 /100 | #273 | Tragic 54.4% |
| Belizeans | 0.2 /100 | #274 | Tragic 54.4% |
| Americans | 0.2 /100 | #275 | Tragic 54.4% |
| Shoshone | 0.2 /100 | #276 | Tragic 54.3% |
| Ecuadorians | 0.2 /100 | #277 | Tragic 54.3% |
| Immigrants | Jamaica | 0.1 /100 | #278 | Tragic 54.2% |
| Arapaho | 0.1 /100 | #279 | Tragic 54.1% |
| Cheyenne | 0.1 /100 | #280 | Tragic 54.1% |
| Colville | 0.1 /100 | #281 | Tragic 54.1% |
Demographics Similar to Immigrants from Hungary by College, 1 year or more
In terms of college, 1 year or more, the demographic groups most similar to Immigrants from Hungary are Immigrants from Western Europe (62.7%, a difference of 0.020%), Immigrants from England (62.8%, a difference of 0.040%), Immigrants from Pakistan (62.8%, a difference of 0.040%), Immigrants from Argentina (62.8%, a difference of 0.080%), and Immigrants from Bolivia (62.8%, a difference of 0.11%).
| Demographics | Rating | Rank | College, 1 year or more |
| Lithuanians | 98.8 /100 | #80 | Exceptional 62.9% |
| Laotians | 98.7 /100 | #81 | Exceptional 62.8% |
| Immigrants | Bolivia | 98.7 /100 | #82 | Exceptional 62.8% |
| Immigrants | Argentina | 98.6 /100 | #83 | Exceptional 62.8% |
| Immigrants | England | 98.6 /100 | #84 | Exceptional 62.8% |
| Immigrants | Pakistan | 98.6 /100 | #85 | Exceptional 62.8% |
| Immigrants | Western Europe | 98.6 /100 | #86 | Exceptional 62.7% |
| Immigrants | Hungary | 98.6 /100 | #87 | Exceptional 62.7% |
| Greeks | 98.3 /100 | #88 | Exceptional 62.6% |
| Immigrants | Ethiopia | 98.2 /100 | #89 | Exceptional 62.6% |
| Immigrants | Western Asia | 97.9 /100 | #90 | Exceptional 62.5% |
| Immigrants | Eastern Europe | 97.8 /100 | #91 | Exceptional 62.4% |
| Immigrants | Egypt | 97.8 /100 | #92 | Exceptional 62.4% |
| Romanians | 97.7 /100 | #93 | Exceptional 62.4% |
| Immigrants | Croatia | 97.6 /100 | #94 | Exceptional 62.3% |