Belizean vs Immigrants from Hungary Householder Income Over 65 years
COMPARE
Belizean
Immigrants from Hungary
Householder Income Over 65 years
Householder Income Over 65 years Comparison
Belizeans
Immigrants from Hungary
$54,580
HOUSEHOLDER INCOME OVER 65 YEARS
0.1/ 100
METRIC RATING
265th/ 347
METRIC RANK
$64,277
HOUSEHOLDER INCOME OVER 65 YEARS
97.0/ 100
METRIC RATING
96th/ 347
METRIC RANK
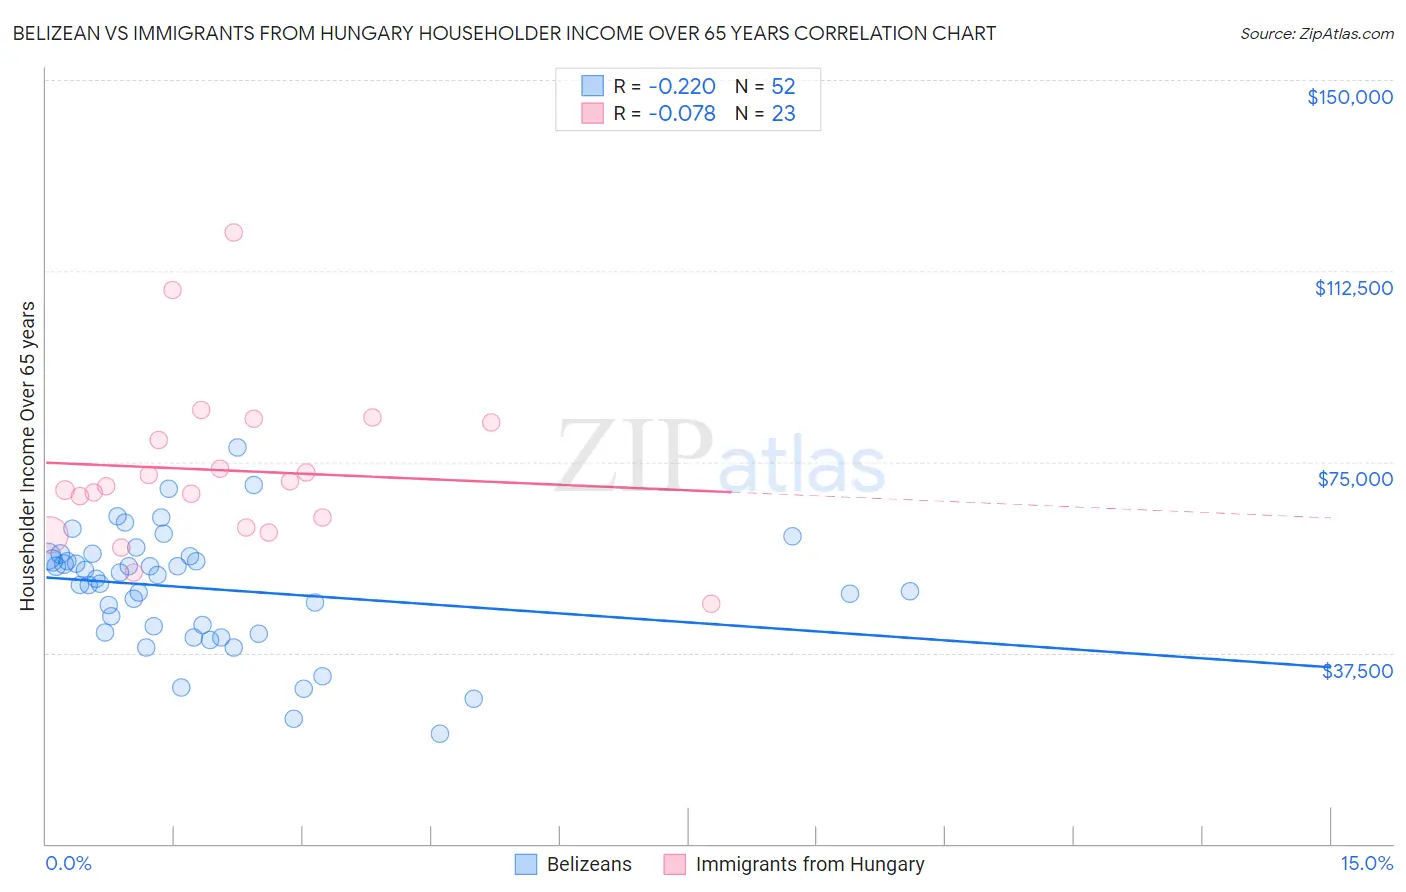
Belizean vs Immigrants from Hungary Householder Income Over 65 years Correlation Chart
The statistical analysis conducted on geographies consisting of 144,062,190 people shows a weak negative correlation between the proportion of Belizeans and household income with householder over the age of 65 in the United States with a correlation coefficient (R) of -0.220 and weighted average of $54,580. Similarly, the statistical analysis conducted on geographies consisting of 195,502,299 people shows a slight negative correlation between the proportion of Immigrants from Hungary and household income with householder over the age of 65 in the United States with a correlation coefficient (R) of -0.078 and weighted average of $64,277, a difference of 17.8%.
Householder Income Over 65 years Correlation Summary
| Measurement | Belizean | Immigrants from Hungary |
| Minimum | $21,611 | $47,165 |
| Maximum | $77,900 | $120,169 |
| Range | $56,289 | $73,004 |
| Mean | $50,124 | $73,307 |
| Median | $52,356 | $70,218 |
| Interquartile 25% (IQ1) | $42,043 | $62,092 |
| Interquartile 75% (IQ3) | $56,363 | $82,782 |
| Interquartile Range (IQR) | $14,320 | $20,690 |
| Standard Deviation (Sample) | $11,589 | $16,316 |
| Standard Deviation (Population) | $11,477 | $15,958 |
Similar Demographics by Householder Income Over 65 years
Demographics Similar to Belizeans by Householder Income Over 65 years
In terms of householder income over 65 years, the demographic groups most similar to Belizeans are Jamaican ($54,560, a difference of 0.040%), Guatemalan ($54,526, a difference of 0.10%), Immigrants from Zaire ($54,512, a difference of 0.13%), Apache ($54,668, a difference of 0.16%), and Nicaraguan ($54,474, a difference of 0.20%).
| Demographics | Rating | Rank | Householder Income Over 65 years |
| Ecuadorians | 0.2 /100 | #258 | Tragic $54,958 |
| West Indians | 0.2 /100 | #259 | Tragic $54,936 |
| Immigrants | West Indies | 0.2 /100 | #260 | Tragic $54,927 |
| Comanche | 0.2 /100 | #261 | Tragic $54,922 |
| Bangladeshis | 0.1 /100 | #262 | Tragic $54,719 |
| French American Indians | 0.1 /100 | #263 | Tragic $54,699 |
| Apache | 0.1 /100 | #264 | Tragic $54,668 |
| Belizeans | 0.1 /100 | #265 | Tragic $54,580 |
| Jamaicans | 0.1 /100 | #266 | Tragic $54,560 |
| Guatemalans | 0.1 /100 | #267 | Tragic $54,526 |
| Immigrants | Zaire | 0.1 /100 | #268 | Tragic $54,512 |
| Nicaraguans | 0.1 /100 | #269 | Tragic $54,474 |
| Immigrants | Senegal | 0.1 /100 | #270 | Tragic $54,447 |
| Liberians | 0.1 /100 | #271 | Tragic $54,356 |
| Potawatomi | 0.1 /100 | #272 | Tragic $54,212 |
Demographics Similar to Immigrants from Hungary by Householder Income Over 65 years
In terms of householder income over 65 years, the demographic groups most similar to Immigrants from Hungary are Immigrants from Egypt ($64,299, a difference of 0.030%), Immigrants from Latvia ($64,298, a difference of 0.030%), Jordanian ($64,313, a difference of 0.060%), Sri Lankan ($64,201, a difference of 0.12%), and Immigrants from Bulgaria ($64,379, a difference of 0.16%).
| Demographics | Rating | Rank | Householder Income Over 65 years |
| Paraguayans | 97.4 /100 | #89 | Exceptional $64,443 |
| Immigrants | Kuwait | 97.4 /100 | #90 | Exceptional $64,433 |
| Immigrants | Oceania | 97.4 /100 | #91 | Exceptional $64,416 |
| Immigrants | Bulgaria | 97.3 /100 | #92 | Exceptional $64,379 |
| Jordanians | 97.1 /100 | #93 | Exceptional $64,313 |
| Immigrants | Egypt | 97.0 /100 | #94 | Exceptional $64,299 |
| Immigrants | Latvia | 97.0 /100 | #95 | Exceptional $64,298 |
| Immigrants | Hungary | 97.0 /100 | #96 | Exceptional $64,277 |
| Sri Lankans | 96.7 /100 | #97 | Exceptional $64,201 |
| Romanians | 96.5 /100 | #98 | Exceptional $64,142 |
| Assyrians/Chaldeans/Syriacs | 96.4 /100 | #99 | Exceptional $64,108 |
| Immigrants | South Eastern Asia | 96.3 /100 | #100 | Exceptional $64,089 |
| Immigrants | Italy | 96.2 /100 | #101 | Exceptional $64,065 |
| Chileans | 95.8 /100 | #102 | Exceptional $63,957 |
| British | 95.7 /100 | #103 | Exceptional $63,940 |