Native Hawaiian vs Immigrants from Hungary College, 1 year or more
COMPARE
Native Hawaiian
Immigrants from Hungary
College, 1 year or more
College, 1 year or more Comparison
Native Hawaiians
Immigrants from Hungary
57.6%
COLLEGE, 1 YEAR OR MORE
9.0/ 100
METRIC RATING
218th/ 347
METRIC RANK
62.7%
COLLEGE, 1 YEAR OR MORE
98.6/ 100
METRIC RATING
87th/ 347
METRIC RANK
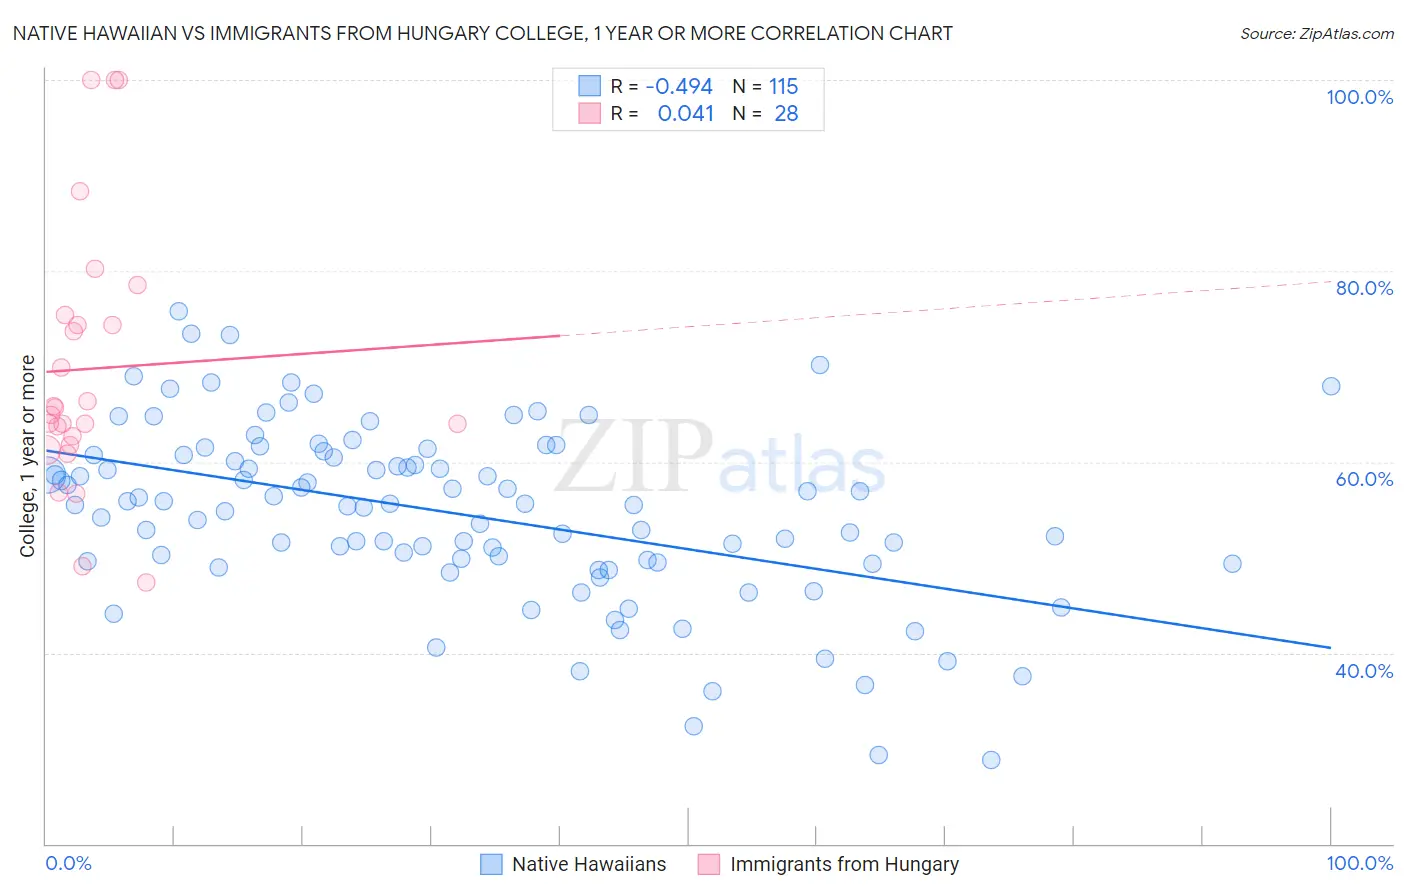
Native Hawaiian vs Immigrants from Hungary College, 1 year or more Correlation Chart
The statistical analysis conducted on geographies consisting of 332,118,930 people shows a moderate negative correlation between the proportion of Native Hawaiians and percentage of population with at least college, 1 year or more education in the United States with a correlation coefficient (R) of -0.494 and weighted average of 57.6%. Similarly, the statistical analysis conducted on geographies consisting of 195,707,305 people shows no correlation between the proportion of Immigrants from Hungary and percentage of population with at least college, 1 year or more education in the United States with a correlation coefficient (R) of 0.041 and weighted average of 62.7%, a difference of 8.9%.
College, 1 year or more Correlation Summary
| Measurement | Native Hawaiian | Immigrants from Hungary |
| Minimum | 28.7% | 47.4% |
| Maximum | 75.7% | 100.0% |
| Range | 47.0% | 52.6% |
| Mean | 54.6% | 69.8% |
| Median | 55.5% | 65.3% |
| Interquartile 25% (IQ1) | 49.5% | 62.2% |
| Interquartile 75% (IQ3) | 60.7% | 74.9% |
| Interquartile Range (IQR) | 11.2% | 12.7% |
| Standard Deviation (Sample) | 9.2% | 13.8% |
| Standard Deviation (Population) | 9.2% | 13.5% |
Similar Demographics by College, 1 year or more
Demographics Similar to Native Hawaiians by College, 1 year or more
In terms of college, 1 year or more, the demographic groups most similar to Native Hawaiians are Immigrants from Panama (57.6%, a difference of 0.0%), White/Caucasian (57.6%, a difference of 0.060%), Immigrants from Costa Rica (57.5%, a difference of 0.18%), Immigrants from Peru (57.7%, a difference of 0.24%), and Immigrants from Ghana (57.4%, a difference of 0.25%).
| Demographics | Rating | Rank | College, 1 year or more |
| Immigrants | Nigeria | 13.3 /100 | #211 | Poor 57.9% |
| Immigrants | Senegal | 11.8 /100 | #212 | Poor 57.8% |
| French Canadians | 11.8 /100 | #213 | Poor 57.8% |
| Immigrants | Colombia | 11.6 /100 | #214 | Poor 57.8% |
| Tongans | 11.6 /100 | #215 | Poor 57.8% |
| Immigrants | Peru | 10.6 /100 | #216 | Poor 57.7% |
| Immigrants | Panama | 9.1 /100 | #217 | Tragic 57.6% |
| Native Hawaiians | 9.0 /100 | #218 | Tragic 57.6% |
| Whites/Caucasians | 8.7 /100 | #219 | Tragic 57.6% |
| Immigrants | Costa Rica | 8.0 /100 | #220 | Tragic 57.5% |
| Immigrants | Ghana | 7.7 /100 | #221 | Tragic 57.4% |
| Sub-Saharan Africans | 6.1 /100 | #222 | Tragic 57.3% |
| Portuguese | 5.4 /100 | #223 | Tragic 57.2% |
| Hmong | 5.4 /100 | #224 | Tragic 57.2% |
| Vietnamese | 4.7 /100 | #225 | Tragic 57.0% |
Demographics Similar to Immigrants from Hungary by College, 1 year or more
In terms of college, 1 year or more, the demographic groups most similar to Immigrants from Hungary are Immigrants from Western Europe (62.7%, a difference of 0.020%), Immigrants from England (62.8%, a difference of 0.040%), Immigrants from Pakistan (62.8%, a difference of 0.040%), Immigrants from Argentina (62.8%, a difference of 0.080%), and Immigrants from Bolivia (62.8%, a difference of 0.11%).
| Demographics | Rating | Rank | College, 1 year or more |
| Lithuanians | 98.8 /100 | #80 | Exceptional 62.9% |
| Laotians | 98.7 /100 | #81 | Exceptional 62.8% |
| Immigrants | Bolivia | 98.7 /100 | #82 | Exceptional 62.8% |
| Immigrants | Argentina | 98.6 /100 | #83 | Exceptional 62.8% |
| Immigrants | England | 98.6 /100 | #84 | Exceptional 62.8% |
| Immigrants | Pakistan | 98.6 /100 | #85 | Exceptional 62.8% |
| Immigrants | Western Europe | 98.6 /100 | #86 | Exceptional 62.7% |
| Immigrants | Hungary | 98.6 /100 | #87 | Exceptional 62.7% |
| Greeks | 98.3 /100 | #88 | Exceptional 62.6% |
| Immigrants | Ethiopia | 98.2 /100 | #89 | Exceptional 62.6% |
| Immigrants | Western Asia | 97.9 /100 | #90 | Exceptional 62.5% |
| Immigrants | Eastern Europe | 97.8 /100 | #91 | Exceptional 62.4% |
| Immigrants | Egypt | 97.8 /100 | #92 | Exceptional 62.4% |
| Romanians | 97.7 /100 | #93 | Exceptional 62.4% |
| Immigrants | Croatia | 97.6 /100 | #94 | Exceptional 62.3% |