Immigrants from Cuba vs Immigrants from Hungary College, 1 year or more
COMPARE
Immigrants from Cuba
Immigrants from Hungary
College, 1 year or more
College, 1 year or more Comparison
Immigrants from Cuba
Immigrants from Hungary
50.7%
COLLEGE, 1 YEAR OR MORE
0.0/ 100
METRIC RATING
324th/ 347
METRIC RANK
62.7%
COLLEGE, 1 YEAR OR MORE
98.6/ 100
METRIC RATING
87th/ 347
METRIC RANK
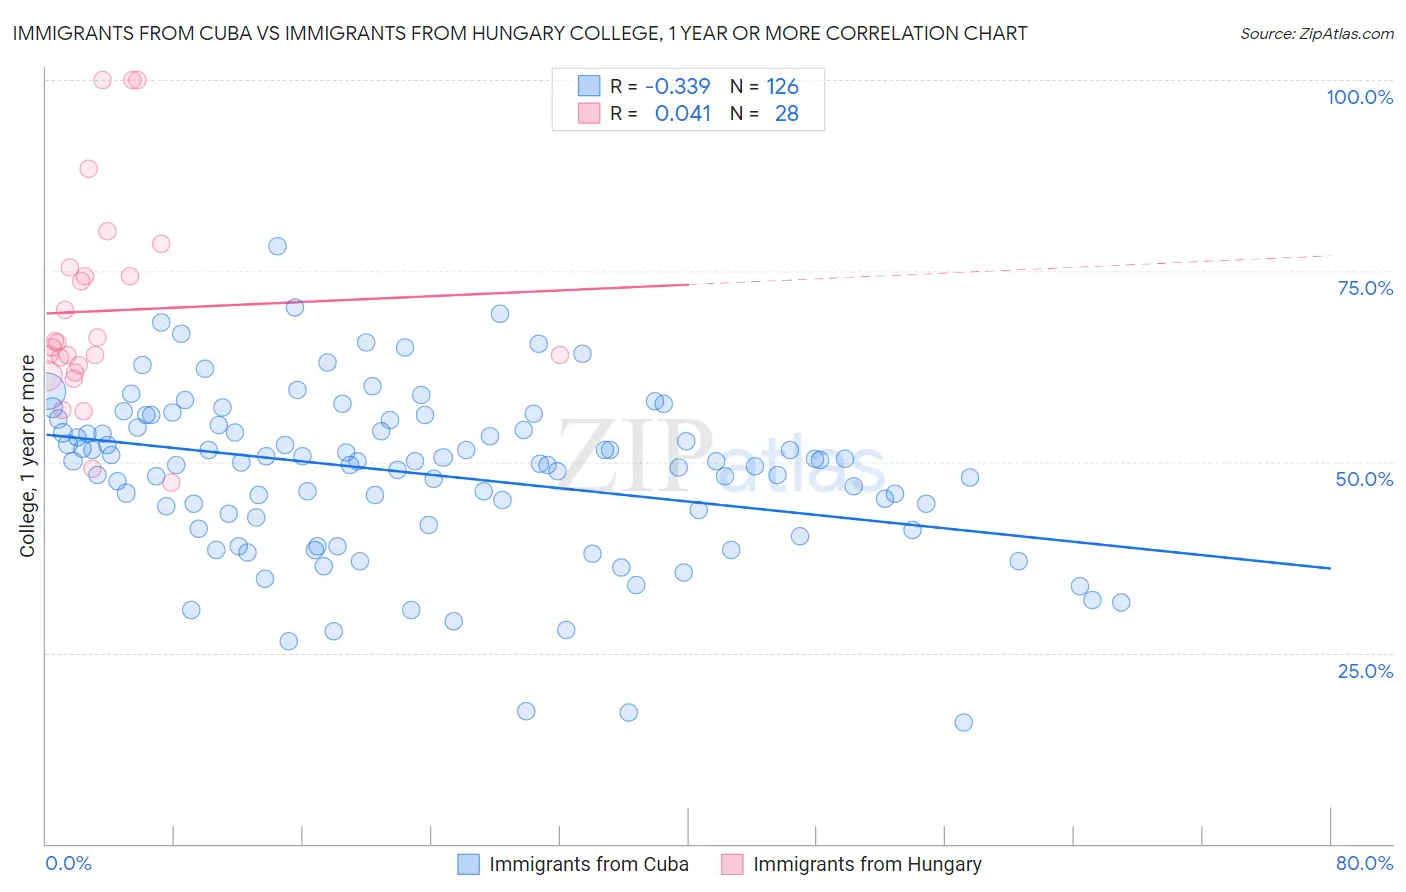
Immigrants from Cuba vs Immigrants from Hungary College, 1 year or more Correlation Chart
The statistical analysis conducted on geographies consisting of 326,030,445 people shows a mild negative correlation between the proportion of Immigrants from Cuba and percentage of population with at least college, 1 year or more education in the United States with a correlation coefficient (R) of -0.339 and weighted average of 50.7%. Similarly, the statistical analysis conducted on geographies consisting of 195,707,305 people shows no correlation between the proportion of Immigrants from Hungary and percentage of population with at least college, 1 year or more education in the United States with a correlation coefficient (R) of 0.041 and weighted average of 62.7%, a difference of 23.8%.
College, 1 year or more Correlation Summary
| Measurement | Immigrants from Cuba | Immigrants from Hungary |
| Minimum | 15.9% | 47.4% |
| Maximum | 78.2% | 100.0% |
| Range | 62.3% | 52.6% |
| Mean | 48.5% | 69.8% |
| Median | 50.1% | 65.3% |
| Interquartile 25% (IQ1) | 42.7% | 62.2% |
| Interquartile 75% (IQ3) | 54.8% | 74.9% |
| Interquartile Range (IQR) | 12.2% | 12.7% |
| Standard Deviation (Sample) | 10.9% | 13.8% |
| Standard Deviation (Population) | 10.8% | 13.5% |
Similar Demographics by College, 1 year or more
Demographics Similar to Immigrants from Cuba by College, 1 year or more
In terms of college, 1 year or more, the demographic groups most similar to Immigrants from Cuba are Immigrants from Guatemala (50.7%, a difference of 0.010%), Immigrants from Latin America (50.7%, a difference of 0.030%), Dominican (50.6%, a difference of 0.21%), Navajo (50.8%, a difference of 0.24%), and Menominee (50.6%, a difference of 0.25%).
| Demographics | Rating | Rank | College, 1 year or more |
| Hispanics or Latinos | 0.0 /100 | #317 | Tragic 51.1% |
| Immigrants | Honduras | 0.0 /100 | #318 | Tragic 51.0% |
| Immigrants | El Salvador | 0.0 /100 | #319 | Tragic 51.0% |
| Kiowa | 0.0 /100 | #320 | Tragic 51.0% |
| Hopi | 0.0 /100 | #321 | Tragic 50.9% |
| Navajo | 0.0 /100 | #322 | Tragic 50.8% |
| Immigrants | Guatemala | 0.0 /100 | #323 | Tragic 50.7% |
| Immigrants | Cuba | 0.0 /100 | #324 | Tragic 50.7% |
| Immigrants | Latin America | 0.0 /100 | #325 | Tragic 50.7% |
| Dominicans | 0.0 /100 | #326 | Tragic 50.6% |
| Menominee | 0.0 /100 | #327 | Tragic 50.6% |
| Dutch West Indians | 0.0 /100 | #328 | Tragic 50.5% |
| Cape Verdeans | 0.0 /100 | #329 | Tragic 50.3% |
| Natives/Alaskans | 0.0 /100 | #330 | Tragic 50.2% |
| Immigrants | Yemen | 0.0 /100 | #331 | Tragic 50.0% |
Demographics Similar to Immigrants from Hungary by College, 1 year or more
In terms of college, 1 year or more, the demographic groups most similar to Immigrants from Hungary are Immigrants from Western Europe (62.7%, a difference of 0.020%), Immigrants from England (62.8%, a difference of 0.040%), Immigrants from Pakistan (62.8%, a difference of 0.040%), Immigrants from Argentina (62.8%, a difference of 0.080%), and Immigrants from Bolivia (62.8%, a difference of 0.11%).
| Demographics | Rating | Rank | College, 1 year or more |
| Lithuanians | 98.8 /100 | #80 | Exceptional 62.9% |
| Laotians | 98.7 /100 | #81 | Exceptional 62.8% |
| Immigrants | Bolivia | 98.7 /100 | #82 | Exceptional 62.8% |
| Immigrants | Argentina | 98.6 /100 | #83 | Exceptional 62.8% |
| Immigrants | England | 98.6 /100 | #84 | Exceptional 62.8% |
| Immigrants | Pakistan | 98.6 /100 | #85 | Exceptional 62.8% |
| Immigrants | Western Europe | 98.6 /100 | #86 | Exceptional 62.7% |
| Immigrants | Hungary | 98.6 /100 | #87 | Exceptional 62.7% |
| Greeks | 98.3 /100 | #88 | Exceptional 62.6% |
| Immigrants | Ethiopia | 98.2 /100 | #89 | Exceptional 62.6% |
| Immigrants | Western Asia | 97.9 /100 | #90 | Exceptional 62.5% |
| Immigrants | Eastern Europe | 97.8 /100 | #91 | Exceptional 62.4% |
| Immigrants | Egypt | 97.8 /100 | #92 | Exceptional 62.4% |
| Romanians | 97.7 /100 | #93 | Exceptional 62.4% |
| Immigrants | Croatia | 97.6 /100 | #94 | Exceptional 62.3% |