Belizean vs Immigrants from Bahamas Single Mother Households
COMPARE
Belizean
Immigrants from Bahamas
Single Mother Households
Single Mother Households Comparison
Belizeans
Immigrants from Bahamas
7.6%
SINGLE MOTHER HOUSEHOLDS
0.1/ 100
METRIC RATING
273rd/ 347
METRIC RANK
8.0%
SINGLE MOTHER HOUSEHOLDS
0.0/ 100
METRIC RATING
303rd/ 347
METRIC RANK
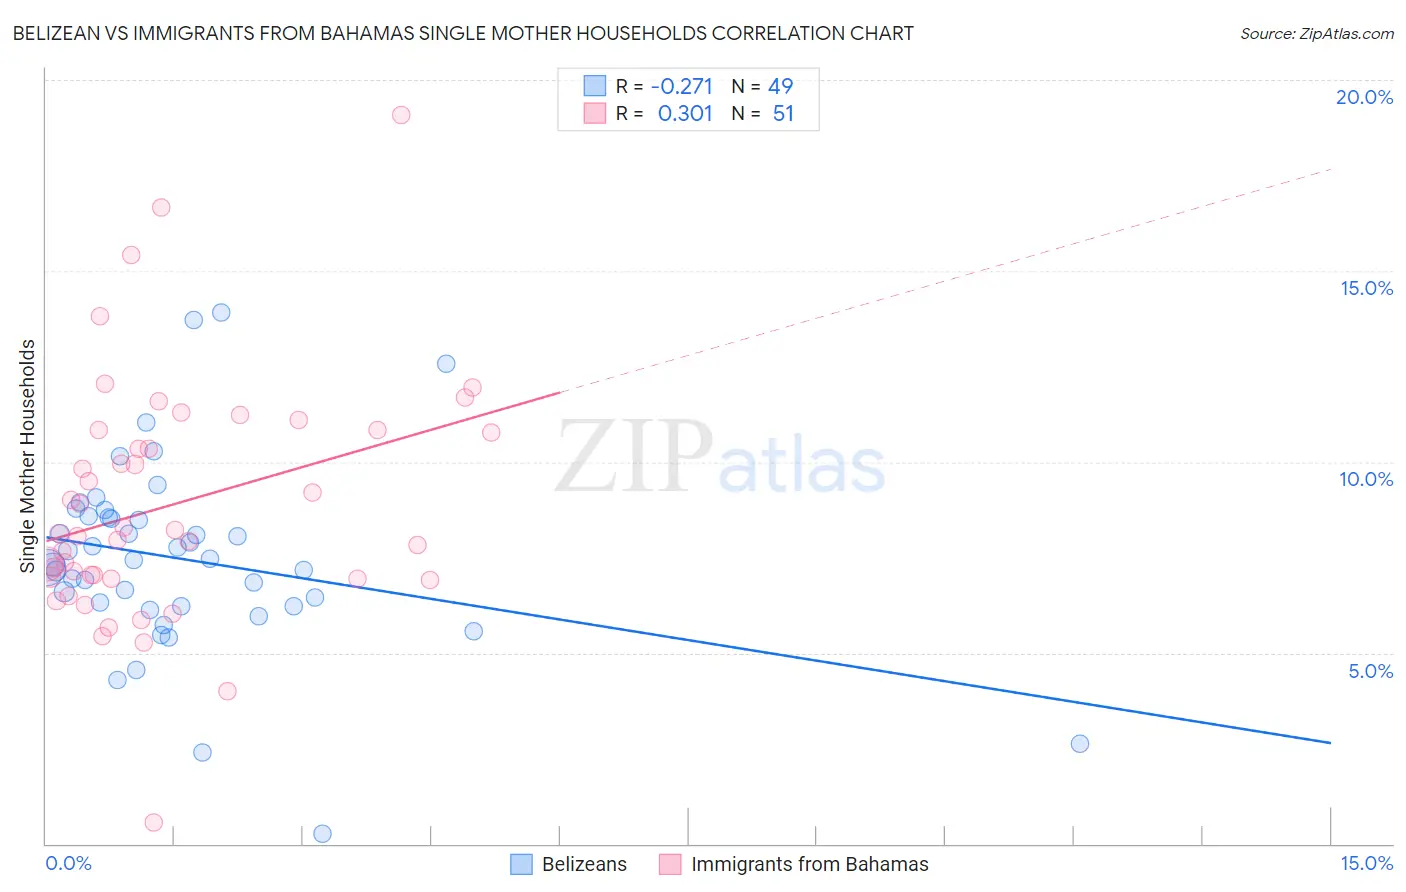
Belizean vs Immigrants from Bahamas Single Mother Households Correlation Chart
The statistical analysis conducted on geographies consisting of 144,083,349 people shows a weak negative correlation between the proportion of Belizeans and percentage of single mother households in the United States with a correlation coefficient (R) of -0.271 and weighted average of 7.6%. Similarly, the statistical analysis conducted on geographies consisting of 104,574,907 people shows a mild positive correlation between the proportion of Immigrants from Bahamas and percentage of single mother households in the United States with a correlation coefficient (R) of 0.301 and weighted average of 8.0%, a difference of 5.7%.
Single Mother Households Correlation Summary
| Measurement | Belizean | Immigrants from Bahamas |
| Minimum | 0.26% | 0.57% |
| Maximum | 13.9% | 19.1% |
| Range | 13.7% | 18.5% |
| Mean | 7.5% | 8.9% |
| Median | 7.4% | 8.1% |
| Interquartile 25% (IQ1) | 6.2% | 6.9% |
| Interquartile 75% (IQ3) | 8.5% | 10.8% |
| Interquartile Range (IQR) | 2.3% | 3.9% |
| Standard Deviation (Sample) | 2.5% | 3.2% |
| Standard Deviation (Population) | 2.5% | 3.1% |
Similar Demographics by Single Mother Households
Demographics Similar to Belizeans by Single Mother Households
In terms of single mother households, the demographic groups most similar to Belizeans are Immigrants from Guyana (7.6%, a difference of 0.040%), Central American Indian (7.6%, a difference of 0.14%), Immigrants from the Azores (7.5%, a difference of 0.31%), Salvadoran (7.5%, a difference of 0.32%), and Immigrants from Cuba (7.5%, a difference of 0.40%).
| Demographics | Rating | Rank | Single Mother Households |
| Nepalese | 0.1 /100 | #266 | Tragic 7.5% |
| Blackfeet | 0.1 /100 | #267 | Tragic 7.5% |
| Indonesians | 0.1 /100 | #268 | Tragic 7.5% |
| Somalis | 0.1 /100 | #269 | Tragic 7.5% |
| Immigrants | Cuba | 0.1 /100 | #270 | Tragic 7.5% |
| Salvadorans | 0.1 /100 | #271 | Tragic 7.5% |
| Immigrants | Azores | 0.1 /100 | #272 | Tragic 7.5% |
| Belizeans | 0.1 /100 | #273 | Tragic 7.6% |
| Immigrants | Guyana | 0.1 /100 | #274 | Tragic 7.6% |
| Central American Indians | 0.1 /100 | #275 | Tragic 7.6% |
| Guyanese | 0.1 /100 | #276 | Tragic 7.6% |
| Immigrants | Trinidad and Tobago | 0.1 /100 | #277 | Tragic 7.6% |
| Central Americans | 0.1 /100 | #278 | Tragic 7.6% |
| Immigrants | El Salvador | 0.0 /100 | #279 | Tragic 7.6% |
| Immigrants | Sierra Leone | 0.0 /100 | #280 | Tragic 7.7% |
Demographics Similar to Immigrants from Bahamas by Single Mother Households
In terms of single mother households, the demographic groups most similar to Immigrants from Bahamas are Immigrants from Ghana (8.0%, a difference of 0.020%), Chippewa (8.0%, a difference of 0.12%), Mexican (8.0%, a difference of 0.27%), Native/Alaskan (8.0%, a difference of 0.44%), and Colville (8.0%, a difference of 0.49%).
| Demographics | Rating | Rank | Single Mother Households |
| Immigrants | Latin America | 0.0 /100 | #296 | Tragic 7.9% |
| Hispanics or Latinos | 0.0 /100 | #297 | Tragic 7.9% |
| Immigrants | West Indies | 0.0 /100 | #298 | Tragic 7.9% |
| Houma | 0.0 /100 | #299 | Tragic 7.9% |
| Mexicans | 0.0 /100 | #300 | Tragic 8.0% |
| Chippewa | 0.0 /100 | #301 | Tragic 8.0% |
| Immigrants | Ghana | 0.0 /100 | #302 | Tragic 8.0% |
| Immigrants | Bahamas | 0.0 /100 | #303 | Tragic 8.0% |
| Natives/Alaskans | 0.0 /100 | #304 | Tragic 8.0% |
| Colville | 0.0 /100 | #305 | Tragic 8.0% |
| Immigrants | Barbados | 0.0 /100 | #306 | Tragic 8.0% |
| Immigrants | St. Vincent and the Grenadines | 0.0 /100 | #307 | Tragic 8.0% |
| Immigrants | Central America | 0.0 /100 | #308 | Tragic 8.1% |
| Cheyenne | 0.0 /100 | #309 | Tragic 8.1% |
| Hondurans | 0.0 /100 | #310 | Tragic 8.1% |