Basque vs Afghan 6th Grade

COMPARE

Basque
Race
Ancestry
AfricanAlaska NativeAlaskan AthabascanAlbanianAleutAlsatianAmericanApacheArabArapahoArgentineanArmenianAssyrian/Chaldean/SyriacAustralianAustrianBahamianBangladeshiBarbadianBasqueBelgianBelizeanBermudanBhutaneseBlackfeetBolivianBrazilianBritishBritish West IndianBulgarianBurmeseCajunCambodianCanadianCape VerdeanCarpatho RusynCelticCentral AmericanCentral American IndianCherokeeCheyenneChickasawChileanChineseChippewaChoctawColombianColvilleComancheCosta RicanCreeCreekCroatianCrowCubanCypriotCzechCzechoslovakianDanishDelawareDominicanDutchDutch West IndianEastern EuropeanEcuadorianEgyptianEnglishEstonianEthiopianEuropeanFijianFilipinoFinnishFrenchFrench American IndianFrench CanadianGermanGerman RussianGhanaianGreekGuamanian/ChamorroGuatemalanGuyaneseHaitianHmongHonduranHopiHoumaHungarianIcelanderIndian (Asian)IndonesianInupiatIranianIraqiIrishIroquoisIsraeliItalianJamaicanJapaneseJordanianKenyanKiowaKoreanLaotianLatvianLebaneseLiberianLithuanianLumbeeLuxembourgerMacedonianMalaysianMalteseMarshalleseMenomineeMexicanMexican American IndianMongolianMoroccanNative HawaiianNavajoNepaleseNew ZealanderNicaraguanNigerianNorthern EuropeanNorwegianOkinawanOsageOttawaPaiutePakistaniPalestinianPanamanianParaguayanPennsylvania GermanPeruvianPimaPolishPortuguesePotawatomiPuebloPuerto RicanPuget Sound SalishRomanianRussianSalvadoranSamoanScandinavianScotch-IrishScottishSeminoleSenegaleseSerbianShoshoneSierra LeoneanSiouxSlavicSlovakSloveneSomaliSouth AfricanSouth AmericanSouth American IndianSoviet UnionSpaniardSpanishSpanish AmericanSpanish American IndianSri LankanSubsaharan AfricanSudaneseSwedishSwissSyrianTaiwaneseThaiTlingit-HaidaTohono O'OdhamTonganTrinidadian and TobagonianTsimshianTurkishU.S. Virgin IslanderUgandanUkrainianUruguayanUteVenezuelanVietnameseWelshWest IndianYakamaYaquiYugoslavianYumanYup'ikZimbabwean
Immigration
NonimmigrantsImmigrantsAfghanistanAfricaAlbaniaArgentinaArmeniaAsiaAustraliaAustriaBahamasBangladeshBarbadosBelarusBelgiumBelizeBoliviaBosnia and HerzegovinaBrazilBulgariaBurma/MyanmarCabo VerdeCambodiaCameroonCanadaCaribbeanCentral AmericaChileChinaColombiaCongoCosta RicaCroatiaCubaCzechoslovakiaDenmarkDominicaDominican RepublicEastern AfricaEastern AsiaEastern EuropeEcuadorEgyptEl SalvadorEnglandEritreaEthiopiaEuropeFijiFranceGermanyGhanaGreeceGrenadaGuatemalaGuyanaHaitiHondurasHong KongHungaryIndiaIndonesiaIranIraqIrelandIsraelItalyJamaicaJapanJordanKazakhstanKenyaKoreaKuwaitLaosLatin AmericaLatviaLebanonLiberiaLithuaniaMalaysiaMexicoMicronesiaMiddle AfricaMoldovaMoroccoNepalNetherlandsNicaraguaNigeriaNorth AmericaNorth MacedoniaNorthern AfricaNorthern EuropeNorwayOceaniaPakistanPanamaPeruPhilippinesPolandPortugalRomaniaRussiaSaudi ArabiaScotlandSenegalSerbiaSierra LeoneSingaporeSomaliaSouth AfricaSouth AmericaSouth Central AsiaSouth Eastern AsiaSouthern EuropeSpainSri LankaSt. Vincent and the GrenadinesSudanSwedenSwitzerlandSyriaTaiwanThailandTrinidad and TobagoTurkeyUgandaUkraineUruguayUzbekistanVenezuelaVietnamWest IndiesWestern AfricaWestern AsiaWestern EuropeYemenZaireZimbabweAzores
Afghan
Race
Ancestry
AfghanAfricanAlaska NativeAlaskan AthabascanAlbanianAleutAlsatianAmericanApacheArabArapahoArgentineanArmenianAssyrian/Chaldean/SyriacAustralianAustrianBahamianBangladeshiBarbadianBelgianBelizeanBermudanBhutaneseBlackfeetBolivianBrazilianBritishBritish West IndianBulgarianBurmeseCajunCambodianCanadianCape VerdeanCarpatho RusynCelticCentral AmericanCentral American IndianCherokeeCheyenneChickasawChileanChineseChippewaChoctawColombianColvilleComancheCosta RicanCreeCreekCroatianCrowCubanCypriotCzechCzechoslovakianDanishDelawareDominicanDutchDutch West IndianEastern EuropeanEcuadorianEgyptianEnglishEstonianEthiopianEuropeanFijianFilipinoFinnishFrenchFrench American IndianFrench CanadianGermanGerman RussianGhanaianGreekGuamanian/ChamorroGuatemalanGuyaneseHaitianHmongHonduranHopiHoumaHungarianIcelanderIndian (Asian)IndonesianInupiatIranianIraqiIrishIroquoisIsraeliItalianJamaicanJapaneseJordanianKenyanKiowaKoreanLaotianLatvianLebaneseLiberianLithuanianLumbeeLuxembourgerMacedonianMalaysianMalteseMarshalleseMenomineeMexicanMexican American IndianMongolianMoroccanNative HawaiianNavajoNepaleseNew ZealanderNicaraguanNigerianNorthern EuropeanNorwegianOkinawanOsageOttawaPaiutePakistaniPalestinianPanamanianParaguayanPennsylvania GermanPeruvianPimaPolishPortuguesePotawatomiPuebloPuerto RicanPuget Sound SalishRomanianRussianSalvadoranSamoanScandinavianScotch-IrishScottishSeminoleSenegaleseSerbianShoshoneSierra LeoneanSiouxSlavicSlovakSloveneSomaliSouth AfricanSouth AmericanSouth American IndianSoviet UnionSpaniardSpanishSpanish AmericanSpanish American IndianSri LankanSubsaharan AfricanSudaneseSwedishSwissSyrianTaiwaneseThaiTlingit-HaidaTohono O'OdhamTonganTrinidadian and TobagonianTsimshianTurkishU.S. Virgin IslanderUgandanUkrainianUruguayanUteVenezuelanVietnameseWelshWest IndianYakamaYaquiYugoslavianYumanYup'ikZimbabwean
Immigration
NonimmigrantsImmigrantsAfghanistanAfricaAlbaniaArgentinaArmeniaAsiaAustraliaAustriaBahamasBangladeshBarbadosBelarusBelgiumBelizeBoliviaBosnia and HerzegovinaBrazilBulgariaBurma/MyanmarCabo VerdeCambodiaCameroonCanadaCaribbeanCentral AmericaChileChinaColombiaCongoCosta RicaCroatiaCubaCzechoslovakiaDenmarkDominicaDominican RepublicEastern AfricaEastern AsiaEastern EuropeEcuadorEgyptEl SalvadorEnglandEritreaEthiopiaEuropeFijiFranceGermanyGhanaGreeceGrenadaGuatemalaGuyanaHaitiHondurasHong KongHungaryIndiaIndonesiaIranIraqIrelandIsraelItalyJamaicaJapanJordanKazakhstanKenyaKoreaKuwaitLaosLatin AmericaLatviaLebanonLiberiaLithuaniaMalaysiaMexicoMicronesiaMiddle AfricaMoldovaMoroccoNepalNetherlandsNicaraguaNigeriaNorth AmericaNorth MacedoniaNorthern AfricaNorthern EuropeNorwayOceaniaPakistanPanamaPeruPhilippinesPolandPortugalRomaniaRussiaSaudi ArabiaScotlandSenegalSerbiaSierra LeoneSingaporeSomaliaSouth AfricaSouth AmericaSouth Central AsiaSouth Eastern AsiaSouthern EuropeSpainSri LankaSt. Vincent and the GrenadinesSudanSwedenSwitzerlandSyriaTaiwanThailandTrinidad and TobagoTurkeyUgandaUkraineUruguayUzbekistanVenezuelaVietnamWest IndiesWestern AfricaWestern AsiaWestern EuropeYemenZaireZimbabweAzores
6th Grade
Income
Poverty
Unemployment
Labor Participation
Family Structure
Vehicle Availability
Education Level
Disability

6th Grade Comparison

Basques

Afghans

Exceptional
Tragic
97.4%
6TH GRADE
95.4/ 100
METRIC RATING
117th/ 347
METRIC RANK
96.4%
6TH GRADE
0.2/ 100
METRIC RATING
267th/ 347
METRIC RANK

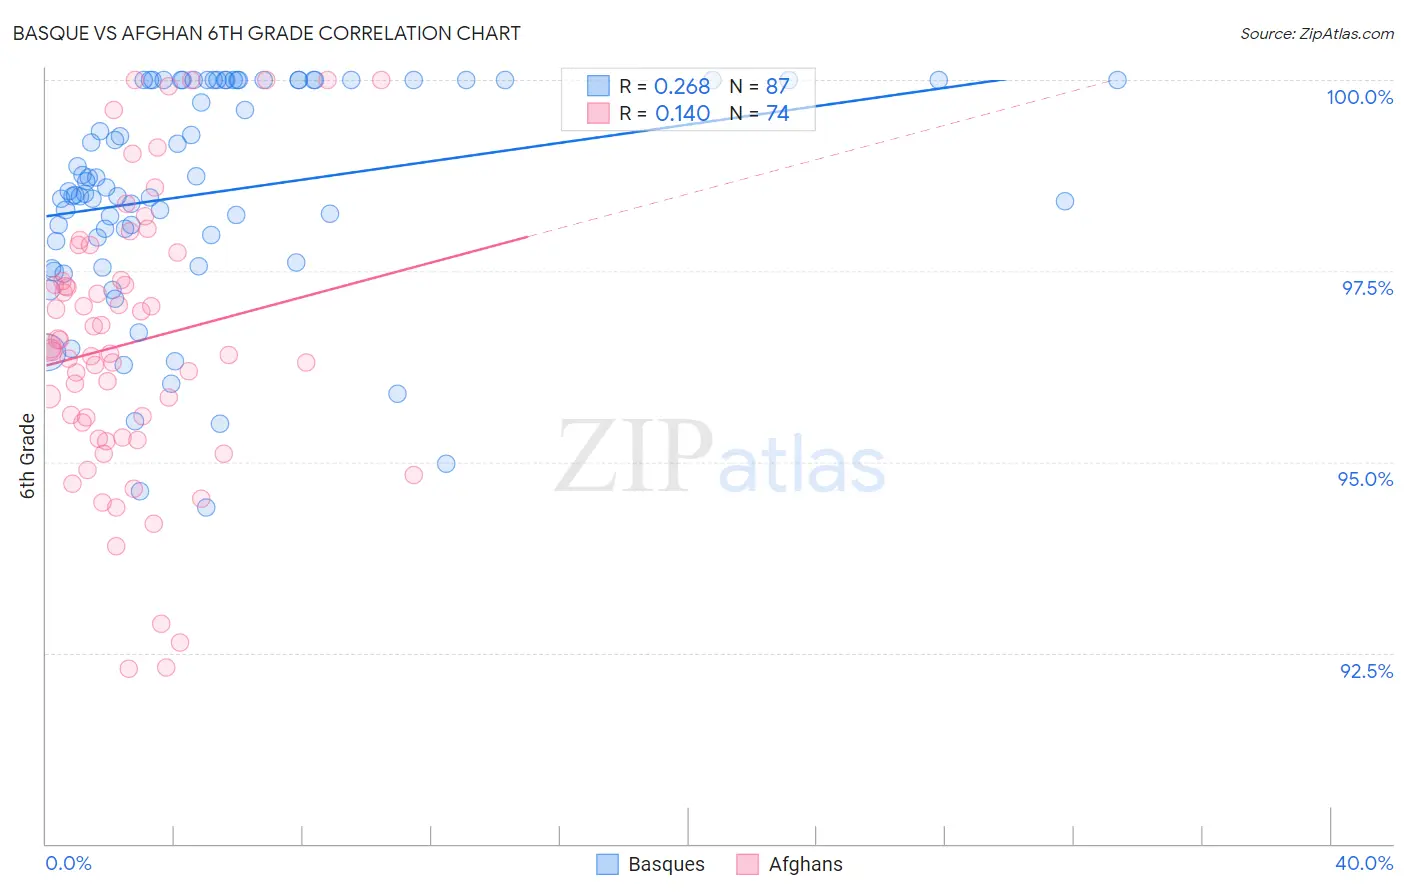
Basque vs Afghan 6th Grade Correlation Chart

The statistical analysis conducted on geographies consisting of 165,772,632 people shows a weak positive correlation between the proportion of Basques and percentage of population with at least 6th grade education in the United States with a correlation coefficient (R) of 0.268 and weighted average of 97.4%. Similarly, the statistical analysis conducted on geographies consisting of 148,851,685 people shows a poor positive correlation between the proportion of Afghans and percentage of population with at least 6th grade education in the United States with a correlation coefficient (R) of 0.140 and weighted average of 96.4%, a difference of 1.1%.
Basque vs Afghan 6th Grade

6th Grade Correlation Summary

MeasurementBasqueAfghan
Minimum94.4%92.3%
Maximum100.0%100.0%
Range5.6%7.7%
Mean98.5%96.6%
Median98.5%96.5%
Interquartile 25% (IQ1)97.9%95.3%
Interquartile 75% (IQ3)100.0%97.4%
Interquartile Range (IQR)2.1%2.1%
Standard Deviation (Sample)1.4%1.8%
Standard Deviation (Population)1.4%1.8%

Similar Demographics by 6th Grade

Demographics Similar to Basques by 6th Grade

In terms of 6th grade, the demographic groups most similar to Basques are Lebanese (97.4%, a difference of 0.0%), Immigrants from Japan (97.4%, a difference of 0.0%), Immigrants from Switzerland (97.4%, a difference of 0.010%), Immigrants from Zimbabwe (97.4%, a difference of 0.010%), and Syrian (97.4%, a difference of 0.010%).
DemographicsRating | Rank6th Grade
Thais
96.9
/100
|
#110
Exceptional
97.4%
Iroquois
96.9
/100
|
#111
Exceptional
97.4%
Immigrants | Latvia
96.7
/100
|
#112
Exceptional
97.4%
Immigrants | Saudi Arabia
96.5
/100
|
#113
Exceptional
97.4%
Colville
96.4
/100
|
#114
Exceptional
97.4%
Immigrants | Switzerland
95.7
/100
|
#115
Exceptional
97.4%
Lebanese
95.5
/100
|
#116
Exceptional
97.4%
Basques
95.4
/100
|
#117
Exceptional
97.4%
Immigrants | Japan
95.2
/100
|
#118
Exceptional
97.4%
Immigrants | Zimbabwe
95.0
/100
|
#119
Exceptional
97.4%
Syrians
94.8
/100
|
#120
Exceptional
97.4%
Immigrants | Norway
94.7
/100
|
#121
Exceptional
97.4%
Immigrants | France
94.5
/100
|
#122
Exceptional
97.4%
Hmong
94.4
/100
|
#123
Exceptional
97.4%
Okinawans
94.2
/100
|
#124
Exceptional
97.4%

Demographics Similar to Afghans by 6th Grade

In terms of 6th grade, the demographic groups most similar to Afghans are Ghanaian (96.4%, a difference of 0.0%), Immigrants from Jamaica (96.4%, a difference of 0.010%), Immigrants from Colombia (96.4%, a difference of 0.020%), Armenian (96.4%, a difference of 0.020%), and Immigrants from Uzbekistan (96.3%, a difference of 0.020%).
DemographicsRating | Rank6th Grade
Peruvians
0.4
/100
|
#260
Tragic
96.4%
Immigrants | Sierra Leone
0.4
/100
|
#261
Tragic
96.4%
Immigrants | Nigeria
0.3
/100
|
#262
Tragic
96.4%
Immigrants | Colombia
0.3
/100
|
#263
Tragic
96.4%
Armenians
0.3
/100
|
#264
Tragic
96.4%
Immigrants | Jamaica
0.2
/100
|
#265
Tragic
96.4%
Ghanaians
0.2
/100
|
#266
Tragic
96.4%
Afghans
0.2
/100
|
#267
Tragic
96.4%
Immigrants | Uzbekistan
0.2
/100
|
#268
Tragic
96.3%
West Indians
0.2
/100
|
#269
Tragic
96.3%
Immigrants | South America
0.2
/100
|
#270
Tragic
96.3%
Immigrants | Hong Kong
0.2
/100
|
#271
Tragic
96.3%
Immigrants | Bolivia
0.1
/100
|
#272
Tragic
96.3%
Immigrants | Cameroon
0.1
/100
|
#273
Tragic
96.3%
Immigrants | Philippines
0.1
/100
|
#274
Tragic
96.3%