Basque vs Afghan In Labor Force | Age 20-24
COMPARE
Basque
Afghan
In Labor Force | Age 20-24
In Labor Force | Age 20-24 Comparison
Basques
Afghans
76.5%
IN LABOR FORCE | AGE 20-24
99.5/ 100
METRIC RATING
81st/ 347
METRIC RANK
75.2%
IN LABOR FORCE | AGE 20-24
63.5/ 100
METRIC RATING
165th/ 347
METRIC RANK
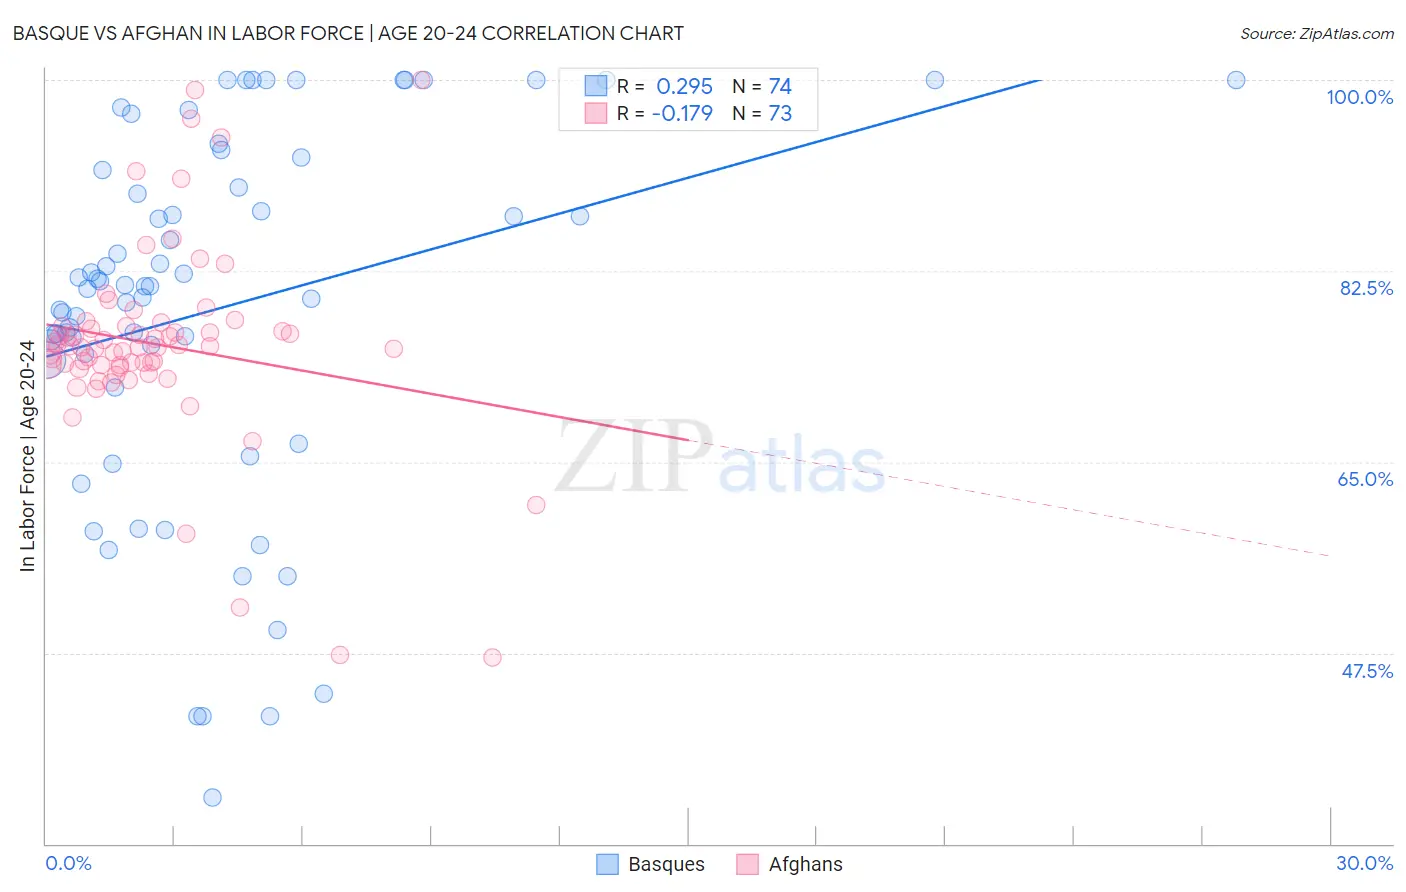
Basque vs Afghan In Labor Force | Age 20-24 Correlation Chart
The statistical analysis conducted on geographies consisting of 165,718,076 people shows a weak positive correlation between the proportion of Basques and labor force participation rate among population between the ages 20 and 24 in the United States with a correlation coefficient (R) of 0.295 and weighted average of 76.5%. Similarly, the statistical analysis conducted on geographies consisting of 148,869,972 people shows a poor negative correlation between the proportion of Afghans and labor force participation rate among population between the ages 20 and 24 in the United States with a correlation coefficient (R) of -0.179 and weighted average of 75.2%, a difference of 1.8%.
In Labor Force | Age 20-24 Correlation Summary
| Measurement | Basque | Afghan |
| Minimum | 34.2% | 47.1% |
| Maximum | 100.0% | 100.0% |
| Range | 65.8% | 52.9% |
| Mean | 79.0% | 75.8% |
| Median | 81.1% | 75.5% |
| Interquartile 25% (IQ1) | 74.4% | 73.8% |
| Interquartile 75% (IQ3) | 91.7% | 77.4% |
| Interquartile Range (IQR) | 17.3% | 3.6% |
| Standard Deviation (Sample) | 16.7% | 9.0% |
| Standard Deviation (Population) | 16.6% | 8.9% |
Similar Demographics by In Labor Force | Age 20-24
Demographics Similar to Basques by In Labor Force | Age 20-24
In terms of in labor force | age 20-24, the demographic groups most similar to Basques are Hmong (76.5%, a difference of 0.0%), Italian (76.5%, a difference of 0.020%), Immigrants from Zaire (76.6%, a difference of 0.040%), Canadian (76.6%, a difference of 0.060%), and Immigrants from Cameroon (76.6%, a difference of 0.070%).
| Demographics | Rating | Rank | In Labor Force | Age 20-24 |
| Cree | 99.7 /100 | #74 | Exceptional 76.6% |
| Immigrants | Middle Africa | 99.7 /100 | #75 | Exceptional 76.6% |
| Immigrants | Moldova | 99.6 /100 | #76 | Exceptional 76.6% |
| Immigrants | Cameroon | 99.6 /100 | #77 | Exceptional 76.6% |
| Canadians | 99.6 /100 | #78 | Exceptional 76.6% |
| Immigrants | Zaire | 99.6 /100 | #79 | Exceptional 76.6% |
| Italians | 99.6 /100 | #80 | Exceptional 76.5% |
| Basques | 99.5 /100 | #81 | Exceptional 76.5% |
| Hmong | 99.5 /100 | #82 | Exceptional 76.5% |
| Carpatho Rusyns | 99.4 /100 | #83 | Exceptional 76.5% |
| Austrians | 99.4 /100 | #84 | Exceptional 76.5% |
| Portuguese | 99.3 /100 | #85 | Exceptional 76.4% |
| Immigrants | Iraq | 99.3 /100 | #86 | Exceptional 76.4% |
| Immigrants | Thailand | 99.3 /100 | #87 | Exceptional 76.4% |
| Spanish | 99.2 /100 | #88 | Exceptional 76.4% |
Demographics Similar to Afghans by In Labor Force | Age 20-24
In terms of in labor force | age 20-24, the demographic groups most similar to Afghans are Costa Rican (75.2%, a difference of 0.010%), Bolivian (75.2%, a difference of 0.010%), Immigrants from Romania (75.2%, a difference of 0.020%), New Zealander (75.2%, a difference of 0.030%), and Cambodian (75.2%, a difference of 0.050%).
| Demographics | Rating | Rank | In Labor Force | Age 20-24 |
| Immigrants | Bolivia | 71.0 /100 | #158 | Good 75.3% |
| South American Indians | 69.0 /100 | #159 | Good 75.3% |
| Japanese | 68.7 /100 | #160 | Good 75.3% |
| New Zealanders | 65.4 /100 | #161 | Good 75.2% |
| Immigrants | Romania | 64.6 /100 | #162 | Good 75.2% |
| Costa Ricans | 64.2 /100 | #163 | Good 75.2% |
| Bolivians | 64.0 /100 | #164 | Good 75.2% |
| Afghans | 63.5 /100 | #165 | Good 75.2% |
| Cambodians | 60.5 /100 | #166 | Good 75.2% |
| Immigrants | South Eastern Asia | 57.5 /100 | #167 | Average 75.1% |
| Immigrants | Western Africa | 56.7 /100 | #168 | Average 75.1% |
| Immigrants | Philippines | 55.8 /100 | #169 | Average 75.1% |
| Mexicans | 52.1 /100 | #170 | Average 75.1% |
| Cajuns | 51.1 /100 | #171 | Average 75.1% |
| Yakama | 50.8 /100 | #172 | Average 75.1% |