Immigrants from North America vs Afghan 6th Grade
COMPARE
Immigrants from North America
Afghan
6th Grade
6th Grade Comparison
Immigrants from North America
Afghans
97.7%
6TH GRADE
99.7/ 100
METRIC RATING
62nd/ 347
METRIC RANK
96.4%
6TH GRADE
0.2/ 100
METRIC RATING
267th/ 347
METRIC RANK
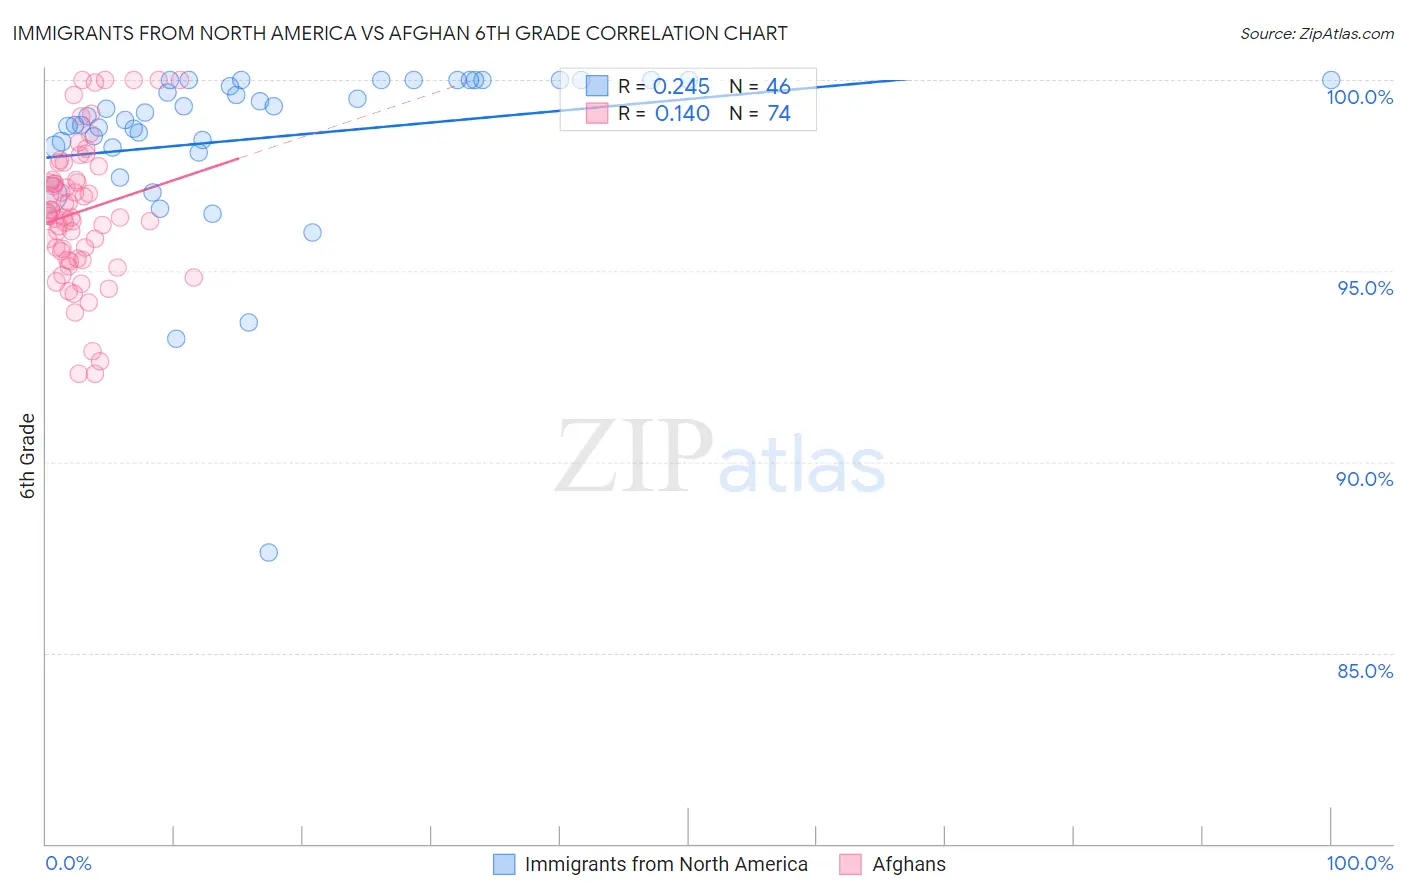
Immigrants from North America vs Afghan 6th Grade Correlation Chart
The statistical analysis conducted on geographies consisting of 462,462,330 people shows a weak positive correlation between the proportion of Immigrants from North America and percentage of population with at least 6th grade education in the United States with a correlation coefficient (R) of 0.245 and weighted average of 97.7%. Similarly, the statistical analysis conducted on geographies consisting of 148,851,685 people shows a poor positive correlation between the proportion of Afghans and percentage of population with at least 6th grade education in the United States with a correlation coefficient (R) of 0.140 and weighted average of 96.4%, a difference of 1.4%.
6th Grade Correlation Summary
| Measurement | Immigrants from North America | Afghan |
| Minimum | 87.6% | 92.3% |
| Maximum | 100.0% | 100.0% |
| Range | 12.4% | 7.7% |
| Mean | 98.5% | 96.6% |
| Median | 99.1% | 96.5% |
| Interquartile 25% (IQ1) | 98.3% | 95.3% |
| Interquartile 75% (IQ3) | 100.0% | 97.4% |
| Interquartile Range (IQR) | 1.7% | 2.1% |
| Standard Deviation (Sample) | 2.3% | 1.8% |
| Standard Deviation (Population) | 2.2% | 1.8% |
Similar Demographics by 6th Grade
Demographics Similar to Immigrants from North America by 6th Grade
In terms of 6th grade, the demographic groups most similar to Immigrants from North America are Immigrants from Canada (97.7%, a difference of 0.010%), Serbian (97.7%, a difference of 0.010%), Russian (97.7%, a difference of 0.010%), Greek (97.7%, a difference of 0.020%), and American (97.7%, a difference of 0.020%).
| Demographics | Rating | Rank | 6th Grade |
| Aleuts | 99.8 /100 | #55 | Exceptional 97.7% |
| Austrians | 99.8 /100 | #56 | Exceptional 97.7% |
| Whites/Caucasians | 99.8 /100 | #57 | Exceptional 97.7% |
| Greeks | 99.8 /100 | #58 | Exceptional 97.7% |
| Americans | 99.8 /100 | #59 | Exceptional 97.7% |
| Immigrants | Canada | 99.8 /100 | #60 | Exceptional 97.7% |
| Serbians | 99.7 /100 | #61 | Exceptional 97.7% |
| Immigrants | North America | 99.7 /100 | #62 | Exceptional 97.7% |
| Russians | 99.7 /100 | #63 | Exceptional 97.7% |
| Canadians | 99.7 /100 | #64 | Exceptional 97.7% |
| Immigrants | Northern Europe | 99.6 /100 | #65 | Exceptional 97.7% |
| New Zealanders | 99.6 /100 | #66 | Exceptional 97.7% |
| Kiowa | 99.6 /100 | #67 | Exceptional 97.7% |
| Immigrants | Austria | 99.6 /100 | #68 | Exceptional 97.7% |
| Iranians | 99.6 /100 | #69 | Exceptional 97.6% |
Demographics Similar to Afghans by 6th Grade
In terms of 6th grade, the demographic groups most similar to Afghans are Ghanaian (96.4%, a difference of 0.0%), Immigrants from Jamaica (96.4%, a difference of 0.010%), Immigrants from Colombia (96.4%, a difference of 0.020%), Armenian (96.4%, a difference of 0.020%), and Immigrants from Uzbekistan (96.3%, a difference of 0.020%).
| Demographics | Rating | Rank | 6th Grade |
| Peruvians | 0.4 /100 | #260 | Tragic 96.4% |
| Immigrants | Sierra Leone | 0.4 /100 | #261 | Tragic 96.4% |
| Immigrants | Nigeria | 0.3 /100 | #262 | Tragic 96.4% |
| Immigrants | Colombia | 0.3 /100 | #263 | Tragic 96.4% |
| Armenians | 0.3 /100 | #264 | Tragic 96.4% |
| Immigrants | Jamaica | 0.2 /100 | #265 | Tragic 96.4% |
| Ghanaians | 0.2 /100 | #266 | Tragic 96.4% |
| Afghans | 0.2 /100 | #267 | Tragic 96.4% |
| Immigrants | Uzbekistan | 0.2 /100 | #268 | Tragic 96.3% |
| West Indians | 0.2 /100 | #269 | Tragic 96.3% |
| Immigrants | South America | 0.2 /100 | #270 | Tragic 96.3% |
| Immigrants | Hong Kong | 0.2 /100 | #271 | Tragic 96.3% |
| Immigrants | Bolivia | 0.1 /100 | #272 | Tragic 96.3% |
| Immigrants | Cameroon | 0.1 /100 | #273 | Tragic 96.3% |
| Immigrants | Philippines | 0.1 /100 | #274 | Tragic 96.3% |