Basque vs Immigrants from Sri Lanka 6th Grade
COMPARE
Basque
Immigrants from Sri Lanka
6th Grade
6th Grade Comparison
Basques
Immigrants from Sri Lanka
97.4%
6TH GRADE
95.4/ 100
METRIC RATING
117th/ 347
METRIC RANK
97.1%
6TH GRADE
51.7/ 100
METRIC RATING
171st/ 347
METRIC RANK
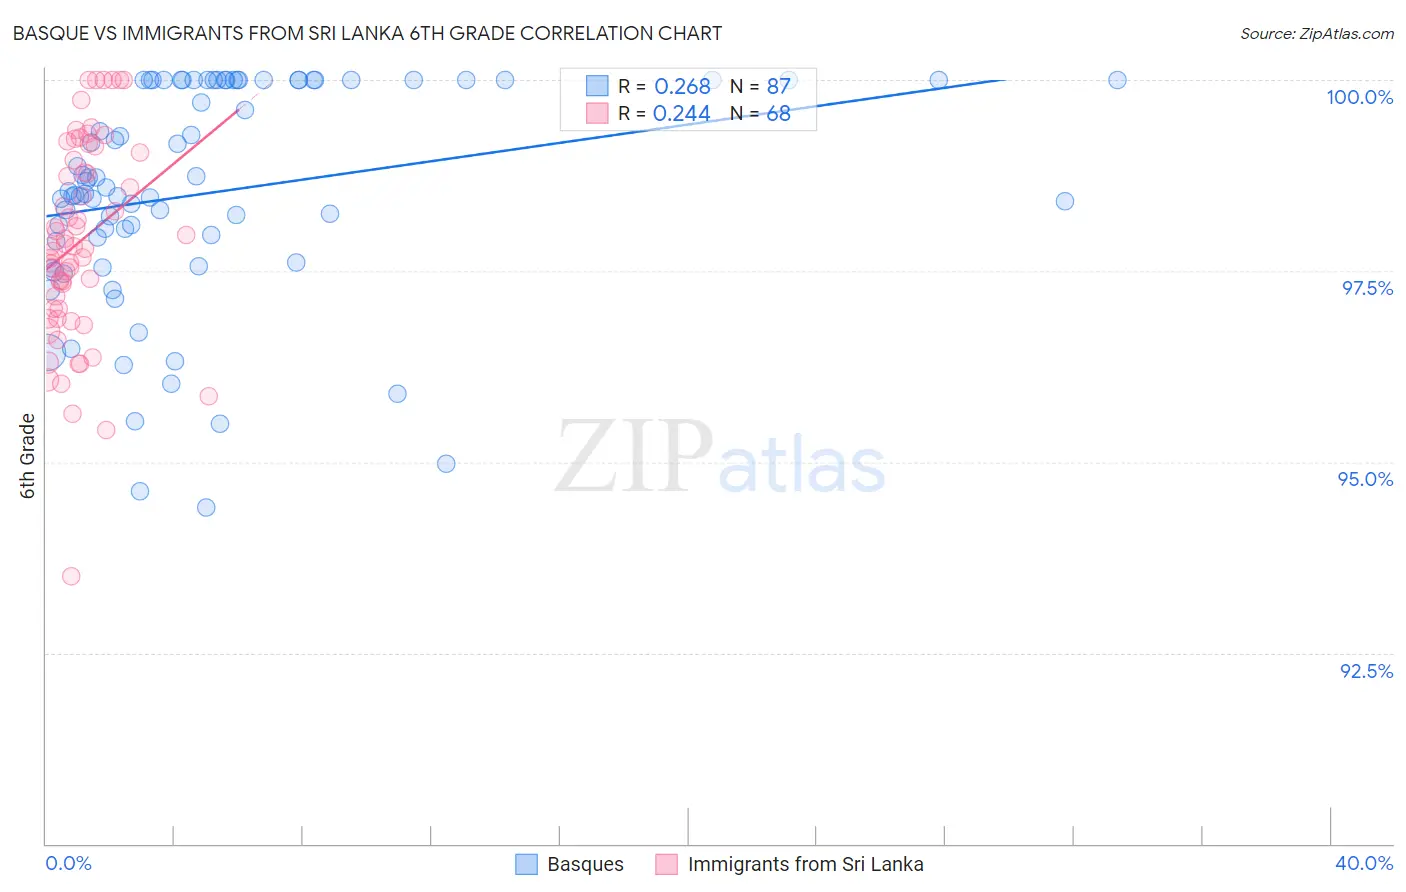
Basque vs Immigrants from Sri Lanka 6th Grade Correlation Chart
The statistical analysis conducted on geographies consisting of 165,772,632 people shows a weak positive correlation between the proportion of Basques and percentage of population with at least 6th grade education in the United States with a correlation coefficient (R) of 0.268 and weighted average of 97.4%. Similarly, the statistical analysis conducted on geographies consisting of 149,673,469 people shows a weak positive correlation between the proportion of Immigrants from Sri Lanka and percentage of population with at least 6th grade education in the United States with a correlation coefficient (R) of 0.244 and weighted average of 97.1%, a difference of 0.34%.
6th Grade Correlation Summary
| Measurement | Basque | Immigrants from Sri Lanka |
| Minimum | 94.4% | 93.5% |
| Maximum | 100.0% | 100.0% |
| Range | 5.6% | 6.5% |
| Mean | 98.5% | 97.9% |
| Median | 98.5% | 97.8% |
| Interquartile 25% (IQ1) | 97.9% | 97.0% |
| Interquartile 75% (IQ3) | 100.0% | 99.0% |
| Interquartile Range (IQR) | 2.1% | 2.0% |
| Standard Deviation (Sample) | 1.4% | 1.3% |
| Standard Deviation (Population) | 1.4% | 1.3% |
Similar Demographics by 6th Grade
Demographics Similar to Basques by 6th Grade
In terms of 6th grade, the demographic groups most similar to Basques are Lebanese (97.4%, a difference of 0.0%), Immigrants from Japan (97.4%, a difference of 0.0%), Immigrants from Switzerland (97.4%, a difference of 0.010%), Immigrants from Zimbabwe (97.4%, a difference of 0.010%), and Syrian (97.4%, a difference of 0.010%).
| Demographics | Rating | Rank | 6th Grade |
| Thais | 96.9 /100 | #110 | Exceptional 97.4% |
| Iroquois | 96.9 /100 | #111 | Exceptional 97.4% |
| Immigrants | Latvia | 96.7 /100 | #112 | Exceptional 97.4% |
| Immigrants | Saudi Arabia | 96.5 /100 | #113 | Exceptional 97.4% |
| Colville | 96.4 /100 | #114 | Exceptional 97.4% |
| Immigrants | Switzerland | 95.7 /100 | #115 | Exceptional 97.4% |
| Lebanese | 95.5 /100 | #116 | Exceptional 97.4% |
| Basques | 95.4 /100 | #117 | Exceptional 97.4% |
| Immigrants | Japan | 95.2 /100 | #118 | Exceptional 97.4% |
| Immigrants | Zimbabwe | 95.0 /100 | #119 | Exceptional 97.4% |
| Syrians | 94.8 /100 | #120 | Exceptional 97.4% |
| Immigrants | Norway | 94.7 /100 | #121 | Exceptional 97.4% |
| Immigrants | France | 94.5 /100 | #122 | Exceptional 97.4% |
| Hmong | 94.4 /100 | #123 | Exceptional 97.4% |
| Okinawans | 94.2 /100 | #124 | Exceptional 97.4% |
Demographics Similar to Immigrants from Sri Lanka by 6th Grade
In terms of 6th grade, the demographic groups most similar to Immigrants from Sri Lanka are Bermudan (97.1%, a difference of 0.0%), Chilean (97.1%, a difference of 0.0%), Egyptian (97.1%, a difference of 0.0%), Immigrants from Italy (97.1%, a difference of 0.010%), and Apache (97.1%, a difference of 0.010%).
| Demographics | Rating | Rank | 6th Grade |
| Immigrants | Korea | 57.7 /100 | #164 | Average 97.1% |
| Immigrants | Poland | 56.2 /100 | #165 | Average 97.1% |
| Immigrants | Italy | 53.8 /100 | #166 | Average 97.1% |
| Apache | 53.6 /100 | #167 | Average 97.1% |
| Immigrants | Taiwan | 53.5 /100 | #168 | Average 97.1% |
| Bermudans | 52.6 /100 | #169 | Average 97.1% |
| Chileans | 52.1 /100 | #170 | Average 97.1% |
| Immigrants | Sri Lanka | 51.7 /100 | #171 | Average 97.1% |
| Egyptians | 50.9 /100 | #172 | Average 97.1% |
| Arabs | 50.1 /100 | #173 | Average 97.0% |
| Venezuelans | 50.0 /100 | #174 | Average 97.0% |
| Immigrants | Kazakhstan | 47.3 /100 | #175 | Average 97.0% |
| Immigrants | Micronesia | 47.1 /100 | #176 | Average 97.0% |
| Mongolians | 46.7 /100 | #177 | Average 97.0% |
| Pakistanis | 46.0 /100 | #178 | Average 97.0% |