Finnish vs Afghan 6th Grade
COMPARE
Finnish
Afghan
6th Grade
6th Grade Comparison
Finns
Afghans
98.1%
6TH GRADE
100.0/ 100
METRIC RATING
20th/ 347
METRIC RANK
96.4%
6TH GRADE
0.2/ 100
METRIC RATING
267th/ 347
METRIC RANK
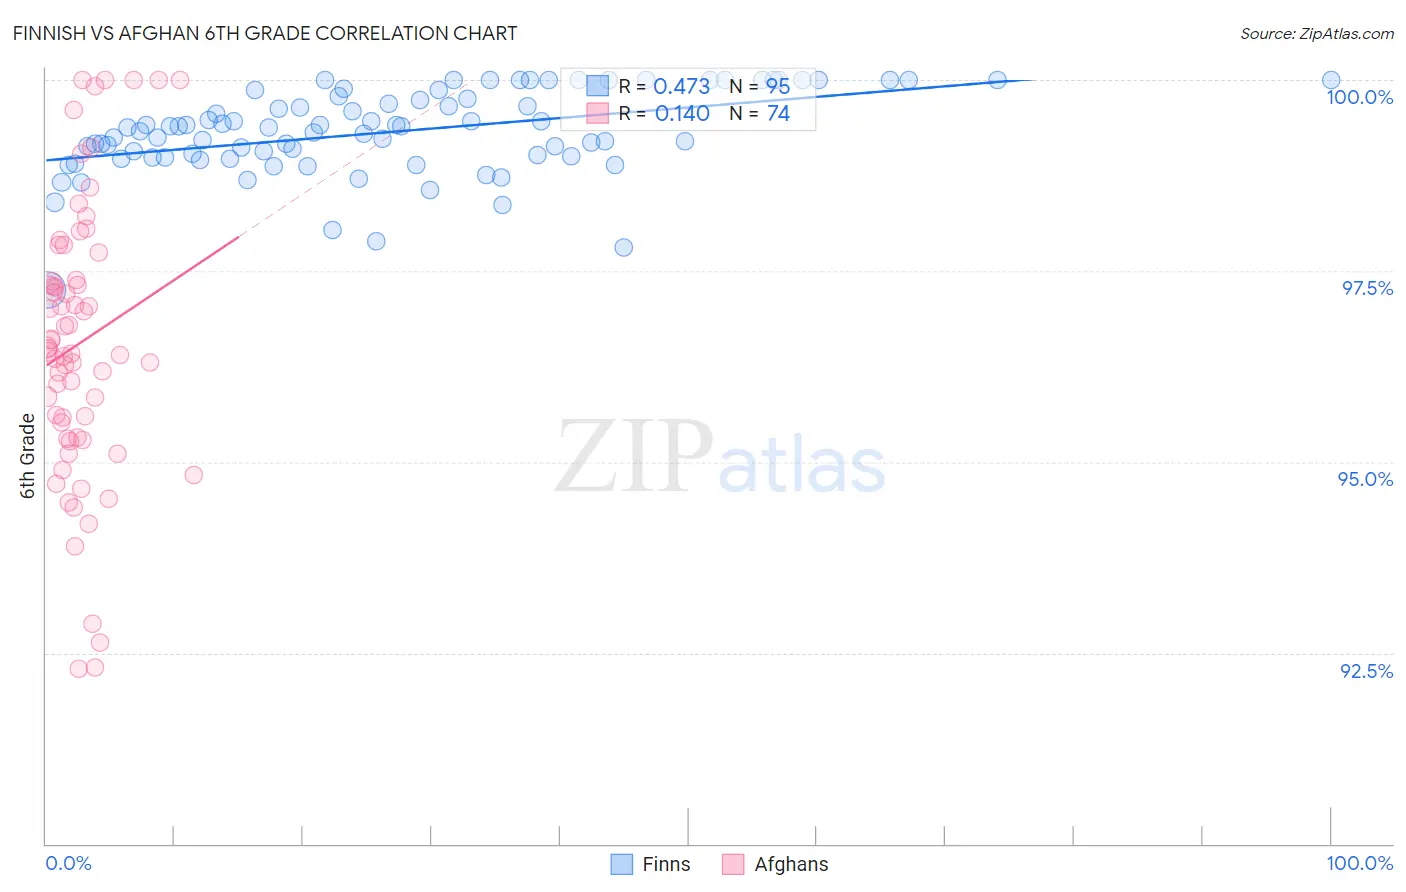
Finnish vs Afghan 6th Grade Correlation Chart
The statistical analysis conducted on geographies consisting of 404,675,625 people shows a moderate positive correlation between the proportion of Finns and percentage of population with at least 6th grade education in the United States with a correlation coefficient (R) of 0.473 and weighted average of 98.1%. Similarly, the statistical analysis conducted on geographies consisting of 148,851,685 people shows a poor positive correlation between the proportion of Afghans and percentage of population with at least 6th grade education in the United States with a correlation coefficient (R) of 0.140 and weighted average of 96.4%, a difference of 1.8%.
6th Grade Correlation Summary
| Measurement | Finnish | Afghan |
| Minimum | 97.2% | 92.3% |
| Maximum | 100.0% | 100.0% |
| Range | 2.8% | 7.7% |
| Mean | 99.3% | 96.6% |
| Median | 99.4% | 96.5% |
| Interquartile 25% (IQ1) | 99.0% | 95.3% |
| Interquartile 75% (IQ3) | 99.8% | 97.4% |
| Interquartile Range (IQR) | 0.79% | 2.1% |
| Standard Deviation (Sample) | 0.56% | 1.8% |
| Standard Deviation (Population) | 0.55% | 1.8% |
Similar Demographics by 6th Grade
Demographics Similar to Finns by 6th Grade
In terms of 6th grade, the demographic groups most similar to Finns are Irish (98.1%, a difference of 0.010%), Lithuanian (98.1%, a difference of 0.010%), Polish (98.1%, a difference of 0.020%), Pennsylvania German (98.1%, a difference of 0.020%), and Inupiat (98.1%, a difference of 0.030%).
| Demographics | Rating | Rank | 6th Grade |
| Tlingit-Haida | 100.0 /100 | #13 | Exceptional 98.1% |
| Carpatho Rusyns | 100.0 /100 | #14 | Exceptional 98.1% |
| Inupiat | 100.0 /100 | #15 | Exceptional 98.1% |
| Scottish | 100.0 /100 | #16 | Exceptional 98.1% |
| Poles | 100.0 /100 | #17 | Exceptional 98.1% |
| Pennsylvania Germans | 100.0 /100 | #18 | Exceptional 98.1% |
| Irish | 100.0 /100 | #19 | Exceptional 98.1% |
| Finns | 100.0 /100 | #20 | Exceptional 98.1% |
| Lithuanians | 100.0 /100 | #21 | Exceptional 98.1% |
| Danes | 100.0 /100 | #22 | Exceptional 98.0% |
| Sioux | 100.0 /100 | #23 | Exceptional 98.0% |
| Croatians | 100.0 /100 | #24 | Exceptional 98.0% |
| Scotch-Irish | 100.0 /100 | #25 | Exceptional 98.0% |
| Czechs | 100.0 /100 | #26 | Exceptional 98.0% |
| Yup'ik | 100.0 /100 | #27 | Exceptional 98.0% |
Demographics Similar to Afghans by 6th Grade
In terms of 6th grade, the demographic groups most similar to Afghans are Ghanaian (96.4%, a difference of 0.0%), Immigrants from Jamaica (96.4%, a difference of 0.010%), Immigrants from Colombia (96.4%, a difference of 0.020%), Armenian (96.4%, a difference of 0.020%), and Immigrants from Uzbekistan (96.3%, a difference of 0.020%).
| Demographics | Rating | Rank | 6th Grade |
| Peruvians | 0.4 /100 | #260 | Tragic 96.4% |
| Immigrants | Sierra Leone | 0.4 /100 | #261 | Tragic 96.4% |
| Immigrants | Nigeria | 0.3 /100 | #262 | Tragic 96.4% |
| Immigrants | Colombia | 0.3 /100 | #263 | Tragic 96.4% |
| Armenians | 0.3 /100 | #264 | Tragic 96.4% |
| Immigrants | Jamaica | 0.2 /100 | #265 | Tragic 96.4% |
| Ghanaians | 0.2 /100 | #266 | Tragic 96.4% |
| Afghans | 0.2 /100 | #267 | Tragic 96.4% |
| Immigrants | Uzbekistan | 0.2 /100 | #268 | Tragic 96.3% |
| West Indians | 0.2 /100 | #269 | Tragic 96.3% |
| Immigrants | South America | 0.2 /100 | #270 | Tragic 96.3% |
| Immigrants | Hong Kong | 0.2 /100 | #271 | Tragic 96.3% |
| Immigrants | Bolivia | 0.1 /100 | #272 | Tragic 96.3% |
| Immigrants | Cameroon | 0.1 /100 | #273 | Tragic 96.3% |
| Immigrants | Philippines | 0.1 /100 | #274 | Tragic 96.3% |