Basque vs Immigrants from Honduras 6th Grade
COMPARE
Basque
Immigrants from Honduras
6th Grade
6th Grade Comparison
Basques
Immigrants from Honduras
97.4%
6TH GRADE
95.4/ 100
METRIC RATING
117th/ 347
METRIC RANK
94.8%
6TH GRADE
0.0/ 100
METRIC RATING
332nd/ 347
METRIC RANK
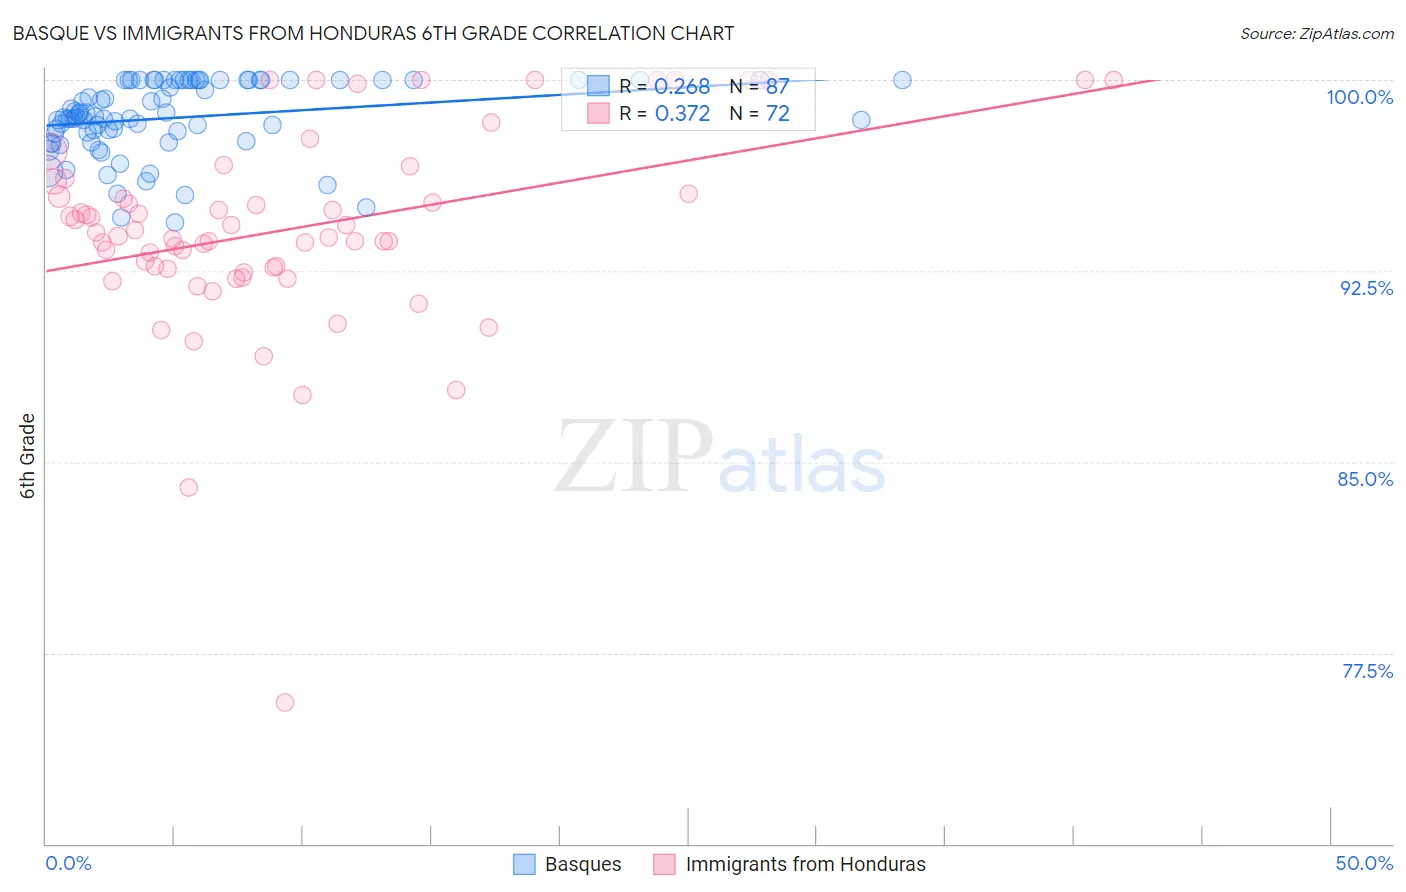
Basque vs Immigrants from Honduras 6th Grade Correlation Chart
The statistical analysis conducted on geographies consisting of 165,772,632 people shows a weak positive correlation between the proportion of Basques and percentage of population with at least 6th grade education in the United States with a correlation coefficient (R) of 0.268 and weighted average of 97.4%. Similarly, the statistical analysis conducted on geographies consisting of 322,637,445 people shows a mild positive correlation between the proportion of Immigrants from Honduras and percentage of population with at least 6th grade education in the United States with a correlation coefficient (R) of 0.372 and weighted average of 94.8%, a difference of 2.8%.
6th Grade Correlation Summary
| Measurement | Basque | Immigrants from Honduras |
| Minimum | 94.4% | 75.6% |
| Maximum | 100.0% | 100.0% |
| Range | 5.6% | 24.4% |
| Mean | 98.5% | 94.2% |
| Median | 98.5% | 93.9% |
| Interquartile 25% (IQ1) | 97.9% | 92.6% |
| Interquartile 75% (IQ3) | 100.0% | 95.8% |
| Interquartile Range (IQR) | 2.1% | 3.2% |
| Standard Deviation (Sample) | 1.4% | 4.0% |
| Standard Deviation (Population) | 1.4% | 3.9% |
Similar Demographics by 6th Grade
Demographics Similar to Basques by 6th Grade
In terms of 6th grade, the demographic groups most similar to Basques are Lebanese (97.4%, a difference of 0.0%), Immigrants from Japan (97.4%, a difference of 0.0%), Immigrants from Switzerland (97.4%, a difference of 0.010%), Immigrants from Zimbabwe (97.4%, a difference of 0.010%), and Syrian (97.4%, a difference of 0.010%).
| Demographics | Rating | Rank | 6th Grade |
| Thais | 96.9 /100 | #110 | Exceptional 97.4% |
| Iroquois | 96.9 /100 | #111 | Exceptional 97.4% |
| Immigrants | Latvia | 96.7 /100 | #112 | Exceptional 97.4% |
| Immigrants | Saudi Arabia | 96.5 /100 | #113 | Exceptional 97.4% |
| Colville | 96.4 /100 | #114 | Exceptional 97.4% |
| Immigrants | Switzerland | 95.7 /100 | #115 | Exceptional 97.4% |
| Lebanese | 95.5 /100 | #116 | Exceptional 97.4% |
| Basques | 95.4 /100 | #117 | Exceptional 97.4% |
| Immigrants | Japan | 95.2 /100 | #118 | Exceptional 97.4% |
| Immigrants | Zimbabwe | 95.0 /100 | #119 | Exceptional 97.4% |
| Syrians | 94.8 /100 | #120 | Exceptional 97.4% |
| Immigrants | Norway | 94.7 /100 | #121 | Exceptional 97.4% |
| Immigrants | France | 94.5 /100 | #122 | Exceptional 97.4% |
| Hmong | 94.4 /100 | #123 | Exceptional 97.4% |
| Okinawans | 94.2 /100 | #124 | Exceptional 97.4% |
Demographics Similar to Immigrants from Honduras by 6th Grade
In terms of 6th grade, the demographic groups most similar to Immigrants from Honduras are Immigrants from Latin America (94.7%, a difference of 0.080%), Immigrants from Armenia (94.9%, a difference of 0.10%), Immigrants from the Azores (94.7%, a difference of 0.10%), Nepalese (94.9%, a difference of 0.11%), and Mexican (94.6%, a difference of 0.12%).
| Demographics | Rating | Rank | 6th Grade |
| Immigrants | Nicaragua | 0.0 /100 | #325 | Tragic 95.1% |
| Hispanics or Latinos | 0.0 /100 | #326 | Tragic 95.0% |
| Mexican American Indians | 0.0 /100 | #327 | Tragic 95.0% |
| Hondurans | 0.0 /100 | #328 | Tragic 95.0% |
| Dominicans | 0.0 /100 | #329 | Tragic 94.9% |
| Nepalese | 0.0 /100 | #330 | Tragic 94.9% |
| Immigrants | Armenia | 0.0 /100 | #331 | Tragic 94.9% |
| Immigrants | Honduras | 0.0 /100 | #332 | Tragic 94.8% |
| Immigrants | Latin America | 0.0 /100 | #333 | Tragic 94.7% |
| Immigrants | Azores | 0.0 /100 | #334 | Tragic 94.7% |
| Mexicans | 0.0 /100 | #335 | Tragic 94.6% |
| Immigrants | Dominican Republic | 0.0 /100 | #336 | Tragic 94.6% |
| Central Americans | 0.0 /100 | #337 | Tragic 94.5% |
| Immigrants | Cabo Verde | 0.0 /100 | #338 | Tragic 94.4% |
| Yakama | 0.0 /100 | #339 | Tragic 94.3% |