Immigrants from Australia vs Immigrants from Uzbekistan 10th Grade

COMPARE

Immigrants from Australia
Race
Ancestry
AfghanAfricanAlaska NativeAlaskan AthabascanAlbanianAleutAlsatianAmericanApacheArabArapahoArgentineanArmenianAssyrian/Chaldean/SyriacAustralianAustrianBahamianBangladeshiBarbadianBasqueBelgianBelizeanBermudanBhutaneseBlackfeetBolivianBrazilianBritishBritish West IndianBulgarianBurmeseCajunCambodianCanadianCape VerdeanCarpatho RusynCelticCentral AmericanCentral American IndianCherokeeCheyenneChickasawChileanChineseChippewaChoctawColombianColvilleComancheCosta RicanCreeCreekCroatianCrowCubanCypriotCzechCzechoslovakianDanishDelawareDominicanDutchDutch West IndianEastern EuropeanEcuadorianEgyptianEnglishEstonianEthiopianEuropeanFijianFilipinoFinnishFrenchFrench American IndianFrench CanadianGermanGerman RussianGhanaianGreekGuamanian/ChamorroGuatemalanGuyaneseHaitianHmongHonduranHopiHoumaHungarianIcelanderIndian (Asian)IndonesianInupiatIranianIraqiIrishIroquoisIsraeliItalianJamaicanJapaneseJordanianKenyanKiowaKoreanLaotianLatvianLebaneseLiberianLithuanianLumbeeLuxembourgerMacedonianMalaysianMalteseMarshalleseMenomineeMexicanMexican American IndianMongolianMoroccanNative HawaiianNavajoNepaleseNew ZealanderNicaraguanNigerianNorthern EuropeanNorwegianOkinawanOsageOttawaPaiutePakistaniPalestinianPanamanianParaguayanPennsylvania GermanPeruvianPimaPolishPortuguesePotawatomiPuebloPuerto RicanPuget Sound SalishRomanianRussianSalvadoranSamoanScandinavianScotch-IrishScottishSeminoleSenegaleseSerbianShoshoneSierra LeoneanSiouxSlavicSlovakSloveneSomaliSouth AfricanSouth AmericanSouth American IndianSoviet UnionSpaniardSpanishSpanish AmericanSpanish American IndianSri LankanSubsaharan AfricanSudaneseSwedishSwissSyrianTaiwaneseThaiTlingit-HaidaTohono O'OdhamTonganTrinidadian and TobagonianTsimshianTurkishU.S. Virgin IslanderUgandanUkrainianUruguayanUteVenezuelanVietnameseWelshWest IndianYakamaYaquiYugoslavianYumanYup'ikZimbabwean
Immigration
NonimmigrantsImmigrantsAfghanistanAfricaAlbaniaArgentinaArmeniaAsiaAustraliaAustriaBahamasBangladeshBarbadosBelarusBelgiumBelizeBoliviaBosnia and HerzegovinaBrazilBulgariaBurma/MyanmarCabo VerdeCambodiaCameroonCanadaCaribbeanCentral AmericaChileChinaColombiaCongoCosta RicaCroatiaCubaCzechoslovakiaDenmarkDominicaDominican RepublicEastern AfricaEastern AsiaEastern EuropeEcuadorEgyptEl SalvadorEnglandEritreaEthiopiaEuropeFijiFranceGermanyGhanaGreeceGrenadaGuatemalaGuyanaHaitiHondurasHong KongHungaryIndiaIndonesiaIranIraqIrelandIsraelItalyJamaicaJapanJordanKazakhstanKenyaKoreaKuwaitLaosLatin AmericaLatviaLebanonLiberiaLithuaniaMalaysiaMexicoMicronesiaMiddle AfricaMoldovaMoroccoNepalNetherlandsNicaraguaNigeriaNorth AmericaNorth MacedoniaNorthern AfricaNorthern EuropeNorwayOceaniaPakistanPanamaPeruPhilippinesPolandPortugalRomaniaRussiaSaudi ArabiaScotlandSenegalSerbiaSierra LeoneSingaporeSomaliaSouth AfricaSouth AmericaSouth Central AsiaSouth Eastern AsiaSouthern EuropeSpainSri LankaSt. Vincent and the GrenadinesSudanSwedenSwitzerlandSyriaTaiwanThailandTrinidad and TobagoTurkeyUgandaUkraineUruguayVenezuelaVietnamWest IndiesWestern AfricaWestern AsiaWestern EuropeYemenZaireZimbabweAzores
Immigrants from Uzbekistan
Race
Ancestry
AfghanAfricanAlaska NativeAlaskan AthabascanAlbanianAleutAlsatianAmericanApacheArabArapahoArgentineanArmenianAssyrian/Chaldean/SyriacAustralianAustrianBahamianBangladeshiBarbadianBasqueBelgianBelizeanBermudanBhutaneseBlackfeetBolivianBrazilianBritishBritish West IndianBulgarianBurmeseCajunCambodianCanadianCape VerdeanCarpatho RusynCelticCentral AmericanCentral American IndianCherokeeCheyenneChickasawChileanChineseChippewaChoctawColombianColvilleComancheCosta RicanCreeCreekCroatianCrowCubanCypriotCzechCzechoslovakianDanishDelawareDominicanDutchDutch West IndianEastern EuropeanEcuadorianEgyptianEnglishEstonianEthiopianEuropeanFijianFilipinoFinnishFrenchFrench American IndianFrench CanadianGermanGerman RussianGhanaianGreekGuamanian/ChamorroGuatemalanGuyaneseHaitianHmongHonduranHopiHoumaHungarianIcelanderIndian (Asian)IndonesianInupiatIranianIraqiIrishIroquoisIsraeliItalianJamaicanJapaneseJordanianKenyanKiowaKoreanLaotianLatvianLebaneseLiberianLithuanianLumbeeLuxembourgerMacedonianMalaysianMalteseMarshalleseMenomineeMexicanMexican American IndianMongolianMoroccanNative HawaiianNavajoNepaleseNew ZealanderNicaraguanNigerianNorthern EuropeanNorwegianOkinawanOsageOttawaPaiutePakistaniPalestinianPanamanianParaguayanPennsylvania GermanPeruvianPimaPolishPortuguesePotawatomiPuebloPuerto RicanPuget Sound SalishRomanianRussianSalvadoranSamoanScandinavianScotch-IrishScottishSeminoleSenegaleseSerbianShoshoneSierra LeoneanSiouxSlavicSlovakSloveneSomaliSouth AfricanSouth AmericanSouth American IndianSoviet UnionSpaniardSpanishSpanish AmericanSpanish American IndianSri LankanSubsaharan AfricanSudaneseSwedishSwissSyrianTaiwaneseThaiTlingit-HaidaTohono O'OdhamTonganTrinidadian and TobagonianTsimshianTurkishU.S. Virgin IslanderUgandanUkrainianUruguayanUteVenezuelanVietnameseWelshWest IndianYakamaYaquiYugoslavianYumanYup'ikZimbabwean
Immigration
NonimmigrantsImmigrantsAfghanistanAfricaAlbaniaArgentinaArmeniaAsiaAustriaBahamasBangladeshBarbadosBelarusBelgiumBelizeBoliviaBosnia and HerzegovinaBrazilBulgariaBurma/MyanmarCabo VerdeCambodiaCameroonCanadaCaribbeanCentral AmericaChileChinaColombiaCongoCosta RicaCroatiaCubaCzechoslovakiaDenmarkDominicaDominican RepublicEastern AfricaEastern AsiaEastern EuropeEcuadorEgyptEl SalvadorEnglandEritreaEthiopiaEuropeFijiFranceGermanyGhanaGreeceGrenadaGuatemalaGuyanaHaitiHondurasHong KongHungaryIndiaIndonesiaIranIraqIrelandIsraelItalyJamaicaJapanJordanKazakhstanKenyaKoreaKuwaitLaosLatin AmericaLatviaLebanonLiberiaLithuaniaMalaysiaMexicoMicronesiaMiddle AfricaMoldovaMoroccoNepalNetherlandsNicaraguaNigeriaNorth AmericaNorth MacedoniaNorthern AfricaNorthern EuropeNorwayOceaniaPakistanPanamaPeruPhilippinesPolandPortugalRomaniaRussiaSaudi ArabiaScotlandSenegalSerbiaSierra LeoneSingaporeSomaliaSouth AfricaSouth AmericaSouth Central AsiaSouth Eastern AsiaSouthern EuropeSpainSri LankaSt. Vincent and the GrenadinesSudanSwedenSwitzerlandSyriaTaiwanThailandTrinidad and TobagoTurkeyUgandaUkraineUruguayUzbekistanVenezuelaVietnamWest IndiesWestern AfricaWestern AsiaWestern EuropeYemenZaireZimbabweAzores
10th Grade
Income
Poverty
Unemployment
Labor Participation
Family Structure
Vehicle Availability
Education Level
Disability

10th Grade Comparison

Immigrants from Australia

Immigrants from Uzbekistan

Exceptional
Tragic
94.9%
10TH GRADE
99.7/ 100
METRIC RATING
66th/ 347
METRIC RANK
92.6%
10TH GRADE
0.5/ 100
METRIC RATING
260th/ 347
METRIC RANK

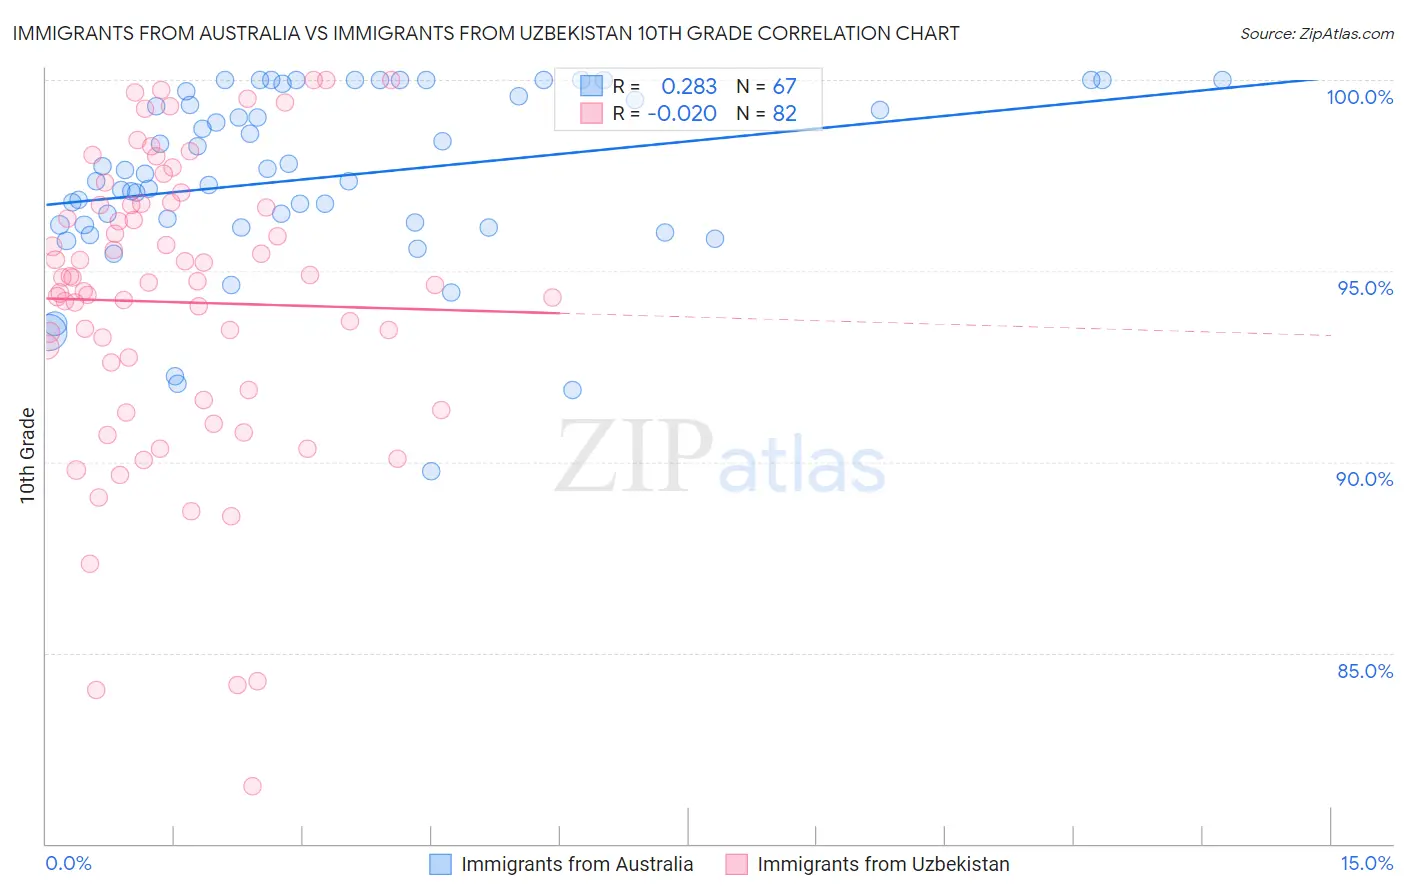
Immigrants from Australia vs Immigrants from Uzbekistan 10th Grade Correlation Chart

The statistical analysis conducted on geographies consisting of 227,202,695 people shows a weak positive correlation between the proportion of Immigrants from Australia and percentage of population with at least 10th grade education in the United States with a correlation coefficient (R) of 0.283 and weighted average of 94.9%. Similarly, the statistical analysis conducted on geographies consisting of 118,684,730 people shows no correlation between the proportion of Immigrants from Uzbekistan and percentage of population with at least 10th grade education in the United States with a correlation coefficient (R) of -0.020 and weighted average of 92.6%, a difference of 2.5%.
Immigrants from Australia vs Immigrants from Uzbekistan 10th Grade

10th Grade Correlation Summary

MeasurementImmigrants from AustraliaImmigrants from Uzbekistan
Minimum89.8%81.5%
Maximum100.0%100.0%
Range10.2%18.5%
Mean97.4%94.2%
Median97.5%94.7%
Interquartile 25% (IQ1)96.2%91.9%
Interquartile 75% (IQ3)99.6%96.7%
Interquartile Range (IQR)3.4%4.8%
Standard Deviation (Sample)2.3%3.9%
Standard Deviation (Population)2.3%3.9%

Similar Demographics by 10th Grade

Demographics Similar to Immigrants from Australia by 10th Grade

In terms of 10th grade, the demographic groups most similar to Immigrants from Australia are Immigrants from Netherlands (94.9%, a difference of 0.0%), Immigrants from Belgium (94.9%, a difference of 0.0%), Immigrants from England (94.9%, a difference of 0.020%), Zimbabwean (94.9%, a difference of 0.030%), and Alaska Native (94.9%, a difference of 0.030%).
DemographicsRating | Rank10th Grade
Celtics
99.8
/100
|
#59
Exceptional
95.0%
Cypriots
99.8
/100
|
#60
Exceptional
95.0%
Chippewa
99.8
/100
|
#61
Exceptional
95.0%
Thais
99.8
/100
|
#62
Exceptional
95.0%
Immigrants | Singapore
99.8
/100
|
#63
Exceptional
95.0%
Native Hawaiians
99.7
/100
|
#64
Exceptional
95.0%
Turks
99.7
/100
|
#65
Exceptional
95.0%
Immigrants | Australia
99.7
/100
|
#66
Exceptional
94.9%
Immigrants | Netherlands
99.7
/100
|
#67
Exceptional
94.9%
Immigrants | Belgium
99.7
/100
|
#68
Exceptional
94.9%
Immigrants | England
99.6
/100
|
#69
Exceptional
94.9%
Zimbabweans
99.6
/100
|
#70
Exceptional
94.9%
Alaska Natives
99.6
/100
|
#71
Exceptional
94.9%
Immigrants | Sweden
99.6
/100
|
#72
Exceptional
94.9%
Bhutanese
99.6
/100
|
#73
Exceptional
94.9%

Demographics Similar to Immigrants from Uzbekistan by 10th Grade

In terms of 10th grade, the demographic groups most similar to Immigrants from Uzbekistan are Immigrants from Jamaica (92.6%, a difference of 0.010%), Paiute (92.6%, a difference of 0.040%), Immigrants from Costa Rica (92.7%, a difference of 0.050%), Immigrants from South America (92.6%, a difference of 0.050%), and Apache (92.6%, a difference of 0.050%).
DemographicsRating | Rank10th Grade
Ghanaians
0.9
/100
|
#253
Tragic
92.8%
Armenians
0.9
/100
|
#254
Tragic
92.7%
Immigrants | Bolivia
0.7
/100
|
#255
Tragic
92.7%
Immigrants | Nigeria
0.7
/100
|
#256
Tragic
92.7%
U.S. Virgin Islanders
0.7
/100
|
#257
Tragic
92.7%
Immigrants | Costa Rica
0.6
/100
|
#258
Tragic
92.7%
Immigrants | Jamaica
0.5
/100
|
#259
Tragic
92.6%
Immigrants | Uzbekistan
0.5
/100
|
#260
Tragic
92.6%
Paiute
0.4
/100
|
#261
Tragic
92.6%
Immigrants | South America
0.4
/100
|
#262
Tragic
92.6%
Apache
0.4
/100
|
#263
Tragic
92.6%
Peruvians
0.4
/100
|
#264
Tragic
92.6%
Dutch West Indians
0.4
/100
|
#265
Tragic
92.6%
Immigrants | Philippines
0.4
/100
|
#266
Tragic
92.6%
Taiwanese
0.3
/100
|
#267
Tragic
92.5%