Thai vs Immigrants from Uzbekistan 10th Grade
COMPARE
Thai
Immigrants from Uzbekistan
10th Grade
10th Grade Comparison
Thais
Immigrants from Uzbekistan
95.0%
10TH GRADE
99.8/ 100
METRIC RATING
62nd/ 347
METRIC RANK
92.6%
10TH GRADE
0.5/ 100
METRIC RATING
260th/ 347
METRIC RANK
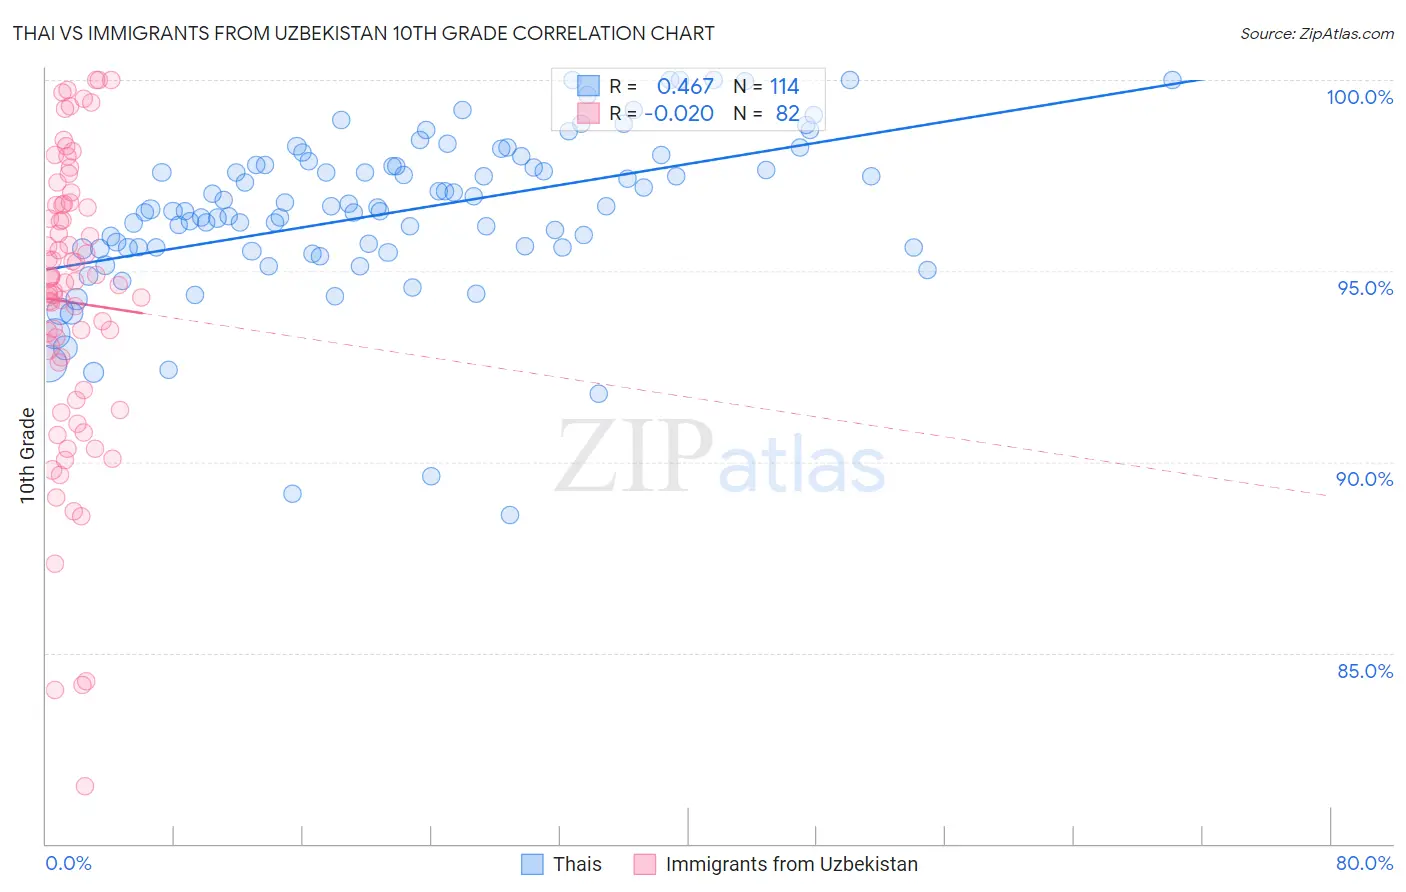
Thai vs Immigrants from Uzbekistan 10th Grade Correlation Chart
The statistical analysis conducted on geographies consisting of 475,814,962 people shows a moderate positive correlation between the proportion of Thais and percentage of population with at least 10th grade education in the United States with a correlation coefficient (R) of 0.467 and weighted average of 95.0%. Similarly, the statistical analysis conducted on geographies consisting of 118,684,730 people shows no correlation between the proportion of Immigrants from Uzbekistan and percentage of population with at least 10th grade education in the United States with a correlation coefficient (R) of -0.020 and weighted average of 92.6%, a difference of 2.6%.
10th Grade Correlation Summary
| Measurement | Thai | Immigrants from Uzbekistan |
| Minimum | 88.6% | 81.5% |
| Maximum | 100.0% | 100.0% |
| Range | 11.4% | 18.5% |
| Mean | 96.5% | 94.2% |
| Median | 96.6% | 94.7% |
| Interquartile 25% (IQ1) | 95.6% | 91.9% |
| Interquartile 75% (IQ3) | 97.8% | 96.7% |
| Interquartile Range (IQR) | 2.2% | 4.8% |
| Standard Deviation (Sample) | 2.2% | 3.9% |
| Standard Deviation (Population) | 2.1% | 3.9% |
Similar Demographics by 10th Grade
Demographics Similar to Thais by 10th Grade
In terms of 10th grade, the demographic groups most similar to Thais are Immigrants from Singapore (95.0%, a difference of 0.0%), Cypriot (95.0%, a difference of 0.010%), Chippewa (95.0%, a difference of 0.010%), Native Hawaiian (95.0%, a difference of 0.010%), and Ukrainian (95.0%, a difference of 0.020%).
| Demographics | Rating | Rank | 10th Grade |
| Immigrants | Ireland | 99.8 /100 | #55 | Exceptional 95.0% |
| New Zealanders | 99.8 /100 | #56 | Exceptional 95.0% |
| Ukrainians | 99.8 /100 | #57 | Exceptional 95.0% |
| Aleuts | 99.8 /100 | #58 | Exceptional 95.0% |
| Celtics | 99.8 /100 | #59 | Exceptional 95.0% |
| Cypriots | 99.8 /100 | #60 | Exceptional 95.0% |
| Chippewa | 99.8 /100 | #61 | Exceptional 95.0% |
| Thais | 99.8 /100 | #62 | Exceptional 95.0% |
| Immigrants | Singapore | 99.8 /100 | #63 | Exceptional 95.0% |
| Native Hawaiians | 99.7 /100 | #64 | Exceptional 95.0% |
| Turks | 99.7 /100 | #65 | Exceptional 95.0% |
| Immigrants | Australia | 99.7 /100 | #66 | Exceptional 94.9% |
| Immigrants | Netherlands | 99.7 /100 | #67 | Exceptional 94.9% |
| Immigrants | Belgium | 99.7 /100 | #68 | Exceptional 94.9% |
| Immigrants | England | 99.6 /100 | #69 | Exceptional 94.9% |
Demographics Similar to Immigrants from Uzbekistan by 10th Grade
In terms of 10th grade, the demographic groups most similar to Immigrants from Uzbekistan are Immigrants from Jamaica (92.6%, a difference of 0.010%), Paiute (92.6%, a difference of 0.040%), Immigrants from Costa Rica (92.7%, a difference of 0.050%), Immigrants from South America (92.6%, a difference of 0.050%), and Apache (92.6%, a difference of 0.050%).
| Demographics | Rating | Rank | 10th Grade |
| Ghanaians | 0.9 /100 | #253 | Tragic 92.8% |
| Armenians | 0.9 /100 | #254 | Tragic 92.7% |
| Immigrants | Bolivia | 0.7 /100 | #255 | Tragic 92.7% |
| Immigrants | Nigeria | 0.7 /100 | #256 | Tragic 92.7% |
| U.S. Virgin Islanders | 0.7 /100 | #257 | Tragic 92.7% |
| Immigrants | Costa Rica | 0.6 /100 | #258 | Tragic 92.7% |
| Immigrants | Jamaica | 0.5 /100 | #259 | Tragic 92.6% |
| Immigrants | Uzbekistan | 0.5 /100 | #260 | Tragic 92.6% |
| Paiute | 0.4 /100 | #261 | Tragic 92.6% |
| Immigrants | South America | 0.4 /100 | #262 | Tragic 92.6% |
| Apache | 0.4 /100 | #263 | Tragic 92.6% |
| Peruvians | 0.4 /100 | #264 | Tragic 92.6% |
| Dutch West Indians | 0.4 /100 | #265 | Tragic 92.6% |
| Immigrants | Philippines | 0.4 /100 | #266 | Tragic 92.6% |
| Taiwanese | 0.3 /100 | #267 | Tragic 92.5% |