Belgian vs Immigrants from Uzbekistan 10th Grade
COMPARE
Belgian
Immigrants from Uzbekistan
10th Grade
10th Grade Comparison
Belgians
Immigrants from Uzbekistan
95.4%
10TH GRADE
100.0/ 100
METRIC RATING
30th/ 347
METRIC RANK
92.6%
10TH GRADE
0.5/ 100
METRIC RATING
260th/ 347
METRIC RANK
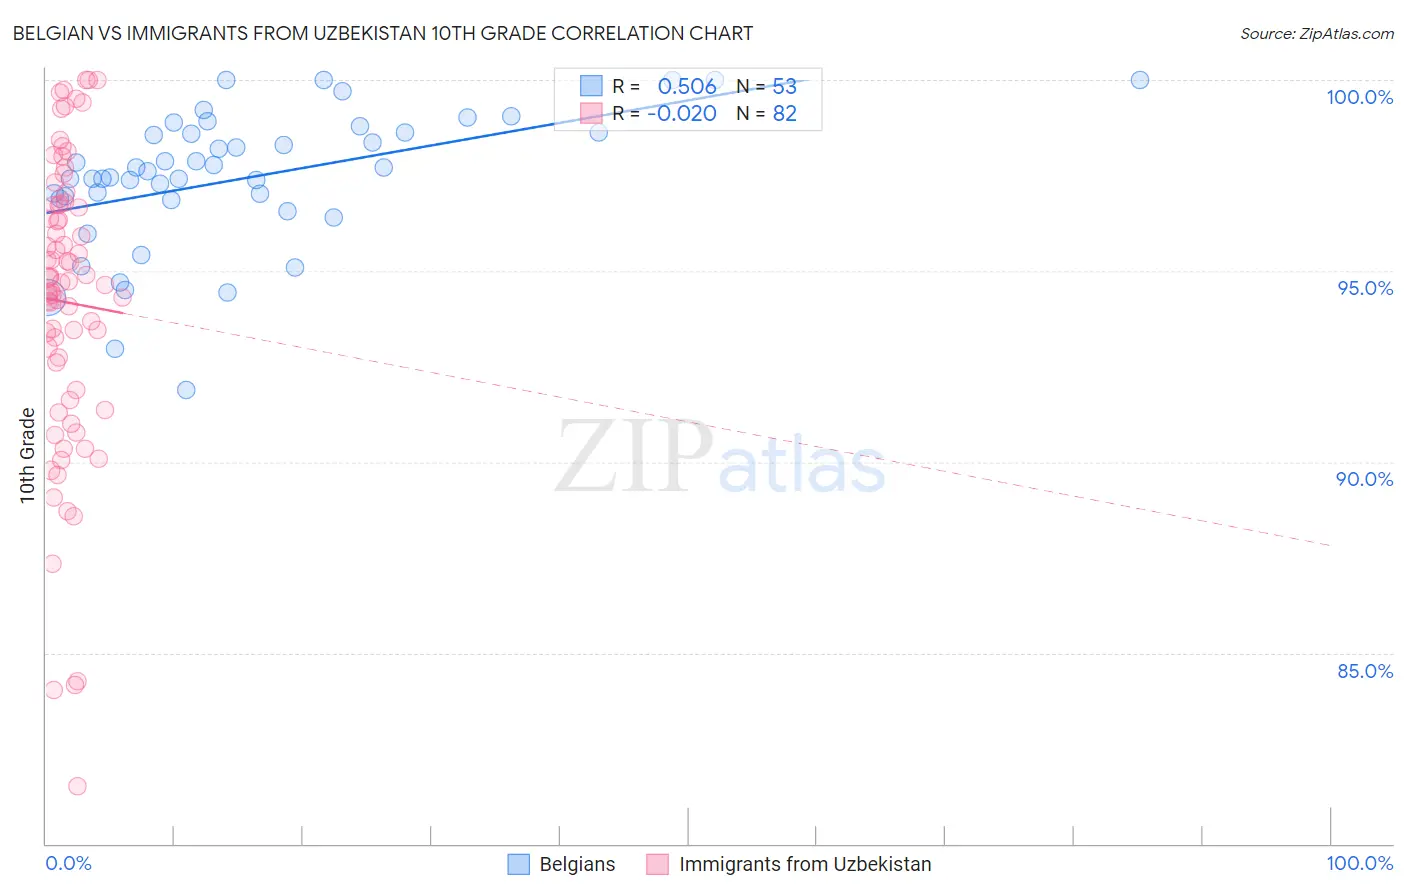
Belgian vs Immigrants from Uzbekistan 10th Grade Correlation Chart
The statistical analysis conducted on geographies consisting of 356,019,281 people shows a substantial positive correlation between the proportion of Belgians and percentage of population with at least 10th grade education in the United States with a correlation coefficient (R) of 0.506 and weighted average of 95.4%. Similarly, the statistical analysis conducted on geographies consisting of 118,684,730 people shows no correlation between the proportion of Immigrants from Uzbekistan and percentage of population with at least 10th grade education in the United States with a correlation coefficient (R) of -0.020 and weighted average of 92.6%, a difference of 2.9%.
10th Grade Correlation Summary
| Measurement | Belgian | Immigrants from Uzbekistan |
| Minimum | 91.9% | 81.5% |
| Maximum | 100.0% | 100.0% |
| Range | 8.1% | 18.5% |
| Mean | 97.4% | 94.2% |
| Median | 97.6% | 94.7% |
| Interquartile 25% (IQ1) | 96.9% | 91.9% |
| Interquartile 75% (IQ3) | 98.6% | 96.7% |
| Interquartile Range (IQR) | 1.7% | 4.8% |
| Standard Deviation (Sample) | 1.8% | 3.9% |
| Standard Deviation (Population) | 1.8% | 3.9% |
Similar Demographics by 10th Grade
Demographics Similar to Belgians by 10th Grade
In terms of 10th grade, the demographic groups most similar to Belgians are Iranian (95.3%, a difference of 0.020%), Hungarian (95.3%, a difference of 0.020%), French (95.3%, a difference of 0.030%), British (95.3%, a difference of 0.030%), and Estonian (95.3%, a difference of 0.040%).
| Demographics | Rating | Rank | 10th Grade |
| Czechs | 100.0 /100 | #23 | Exceptional 95.5% |
| Europeans | 100.0 /100 | #24 | Exceptional 95.5% |
| Maltese | 100.0 /100 | #25 | Exceptional 95.5% |
| Welsh | 100.0 /100 | #26 | Exceptional 95.5% |
| Alaskan Athabascans | 100.0 /100 | #27 | Exceptional 95.4% |
| Luxembourgers | 100.0 /100 | #28 | Exceptional 95.4% |
| Bulgarians | 100.0 /100 | #29 | Exceptional 95.4% |
| Belgians | 100.0 /100 | #30 | Exceptional 95.4% |
| Iranians | 100.0 /100 | #31 | Exceptional 95.3% |
| Hungarians | 100.0 /100 | #32 | Exceptional 95.3% |
| French | 100.0 /100 | #33 | Exceptional 95.3% |
| British | 99.9 /100 | #34 | Exceptional 95.3% |
| Estonians | 99.9 /100 | #35 | Exceptional 95.3% |
| Immigrants | India | 99.9 /100 | #36 | Exceptional 95.3% |
| French Canadians | 99.9 /100 | #37 | Exceptional 95.3% |
Demographics Similar to Immigrants from Uzbekistan by 10th Grade
In terms of 10th grade, the demographic groups most similar to Immigrants from Uzbekistan are Immigrants from Jamaica (92.6%, a difference of 0.010%), Paiute (92.6%, a difference of 0.040%), Immigrants from Costa Rica (92.7%, a difference of 0.050%), Immigrants from South America (92.6%, a difference of 0.050%), and Apache (92.6%, a difference of 0.050%).
| Demographics | Rating | Rank | 10th Grade |
| Ghanaians | 0.9 /100 | #253 | Tragic 92.8% |
| Armenians | 0.9 /100 | #254 | Tragic 92.7% |
| Immigrants | Bolivia | 0.7 /100 | #255 | Tragic 92.7% |
| Immigrants | Nigeria | 0.7 /100 | #256 | Tragic 92.7% |
| U.S. Virgin Islanders | 0.7 /100 | #257 | Tragic 92.7% |
| Immigrants | Costa Rica | 0.6 /100 | #258 | Tragic 92.7% |
| Immigrants | Jamaica | 0.5 /100 | #259 | Tragic 92.6% |
| Immigrants | Uzbekistan | 0.5 /100 | #260 | Tragic 92.6% |
| Paiute | 0.4 /100 | #261 | Tragic 92.6% |
| Immigrants | South America | 0.4 /100 | #262 | Tragic 92.6% |
| Apache | 0.4 /100 | #263 | Tragic 92.6% |
| Peruvians | 0.4 /100 | #264 | Tragic 92.6% |
| Dutch West Indians | 0.4 /100 | #265 | Tragic 92.6% |
| Immigrants | Philippines | 0.4 /100 | #266 | Tragic 92.6% |
| Taiwanese | 0.3 /100 | #267 | Tragic 92.5% |