Barbadian vs Immigrants from Uzbekistan No Schooling Completed
COMPARE
Barbadian
Immigrants from Uzbekistan
No Schooling Completed
No Schooling Completed Comparison
Barbadians
Immigrants from Uzbekistan
2.6%
NO SCHOOLING COMPLETED
0.1/ 100
METRIC RATING
279th/ 347
METRIC RANK
2.6%
NO SCHOOLING COMPLETED
0.1/ 100
METRIC RATING
278th/ 347
METRIC RANK
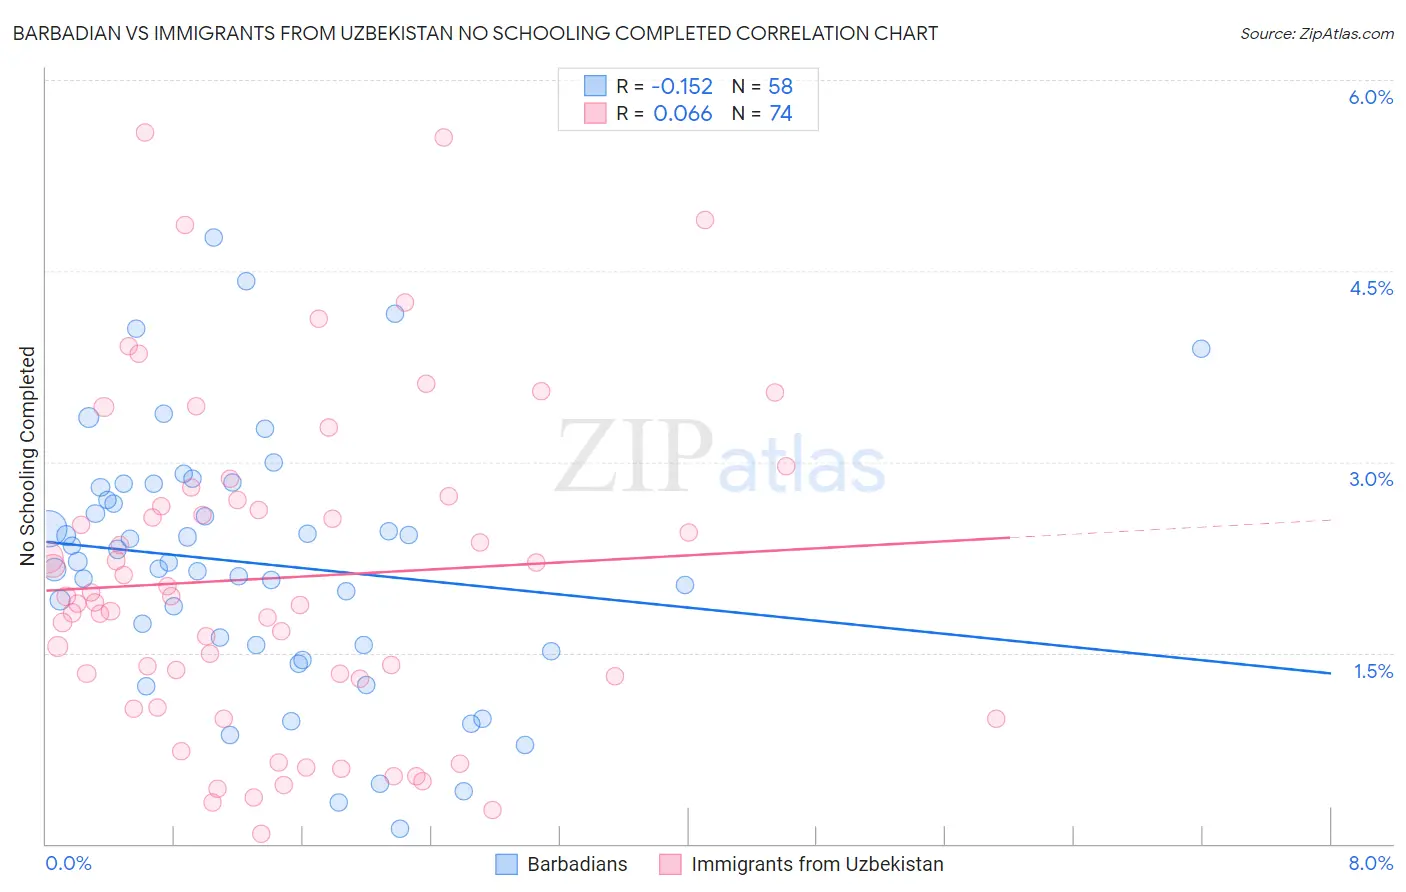
Barbadian vs Immigrants from Uzbekistan No Schooling Completed Correlation Chart
The statistical analysis conducted on geographies consisting of 140,997,327 people shows a poor negative correlation between the proportion of Barbadians and percentage of population with no schooling in the United States with a correlation coefficient (R) of -0.152 and weighted average of 2.6%. Similarly, the statistical analysis conducted on geographies consisting of 118,288,407 people shows a slight positive correlation between the proportion of Immigrants from Uzbekistan and percentage of population with no schooling in the United States with a correlation coefficient (R) of 0.066 and weighted average of 2.6%, a difference of 0.55%.
No Schooling Completed Correlation Summary
| Measurement | Barbadian | Immigrants from Uzbekistan |
| Minimum | 0.12% | 0.076% |
| Maximum | 4.8% | 5.6% |
| Range | 4.6% | 5.5% |
| Mean | 2.2% | 2.1% |
| Median | 2.2% | 1.9% |
| Interquartile 25% (IQ1) | 1.6% | 1.3% |
| Interquartile 75% (IQ3) | 2.8% | 2.7% |
| Interquartile Range (IQR) | 1.2% | 1.4% |
| Standard Deviation (Sample) | 1.0% | 1.3% |
| Standard Deviation (Population) | 0.99% | 1.3% |
Demographics Similar to Barbadians and Immigrants from Uzbekistan by No Schooling Completed
In terms of no schooling completed, the demographic groups most similar to Barbadians are Trinidadian and Tobagonian (2.6%, a difference of 0.020%), Afghan (2.6%, a difference of 0.10%), Immigrants from Ghana (2.6%, a difference of 0.30%), Immigrants from Philippines (2.6%, a difference of 0.74%), and Immigrants from Western Africa (2.6%, a difference of 0.80%). Similarly, the demographic groups most similar to Immigrants from Uzbekistan are Immigrants from Philippines (2.6%, a difference of 0.20%), Immigrants from Western Africa (2.6%, a difference of 0.25%), Trinidadian and Tobagonian (2.6%, a difference of 0.56%), Afghan (2.6%, a difference of 0.64%), and Immigrants from China (2.6%, a difference of 0.81%).
| Demographics | Rating | Rank | No Schooling Completed |
| Taiwanese | 0.3 /100 | #268 | Tragic 2.5% |
| Immigrants | Nigeria | 0.2 /100 | #269 | Tragic 2.5% |
| Immigrants | Peru | 0.2 /100 | #270 | Tragic 2.5% |
| Cubans | 0.2 /100 | #271 | Tragic 2.5% |
| Immigrants | Bolivia | 0.2 /100 | #272 | Tragic 2.5% |
| Immigrants | Cameroon | 0.1 /100 | #273 | Tragic 2.5% |
| Ghanaians | 0.1 /100 | #274 | Tragic 2.6% |
| Immigrants | China | 0.1 /100 | #275 | Tragic 2.6% |
| Immigrants | Western Africa | 0.1 /100 | #276 | Tragic 2.6% |
| Immigrants | Philippines | 0.1 /100 | #277 | Tragic 2.6% |
| Immigrants | Uzbekistan | 0.1 /100 | #278 | Tragic 2.6% |
| Barbadians | 0.1 /100 | #279 | Tragic 2.6% |
| Trinidadians and Tobagonians | 0.1 /100 | #280 | Tragic 2.6% |
| Afghans | 0.1 /100 | #281 | Tragic 2.6% |
| Immigrants | Ghana | 0.1 /100 | #282 | Tragic 2.6% |
| Immigrants | Trinidad and Tobago | 0.0 /100 | #283 | Tragic 2.6% |
| Immigrants | West Indies | 0.0 /100 | #284 | Tragic 2.7% |
| Immigrants | Barbados | 0.0 /100 | #285 | Tragic 2.7% |
| Immigrants | Portugal | 0.0 /100 | #286 | Tragic 2.7% |
| Immigrants | Afghanistan | 0.0 /100 | #287 | Tragic 2.7% |
| Immigrants | St. Vincent and the Grenadines | 0.0 /100 | #288 | Tragic 2.7% |