Barbadian vs Immigrants from Ecuador 9th Grade
COMPARE
Barbadian
Immigrants from Ecuador
9th Grade
9th Grade Comparison
Barbadians
Immigrants from Ecuador
93.5%
9TH GRADE
0.0/ 100
METRIC RATING
283rd/ 347
METRIC RANK
91.8%
9TH GRADE
0.0/ 100
METRIC RATING
321st/ 347
METRIC RANK
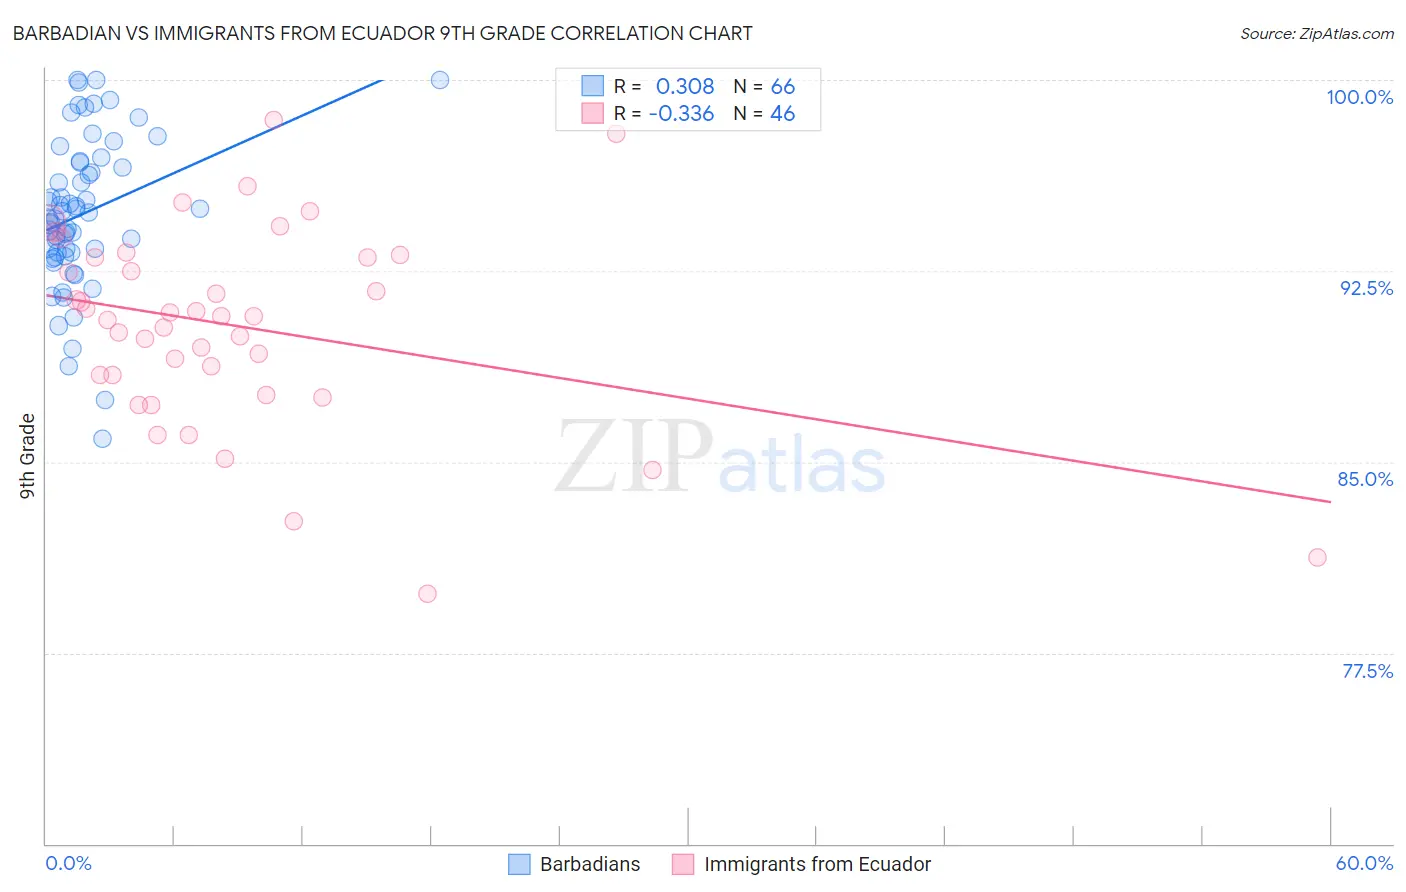
Barbadian vs Immigrants from Ecuador 9th Grade Correlation Chart
The statistical analysis conducted on geographies consisting of 141,304,456 people shows a mild positive correlation between the proportion of Barbadians and percentage of population with at least 9th grade education in the United States with a correlation coefficient (R) of 0.308 and weighted average of 93.5%. Similarly, the statistical analysis conducted on geographies consisting of 270,907,929 people shows a mild negative correlation between the proportion of Immigrants from Ecuador and percentage of population with at least 9th grade education in the United States with a correlation coefficient (R) of -0.336 and weighted average of 91.8%, a difference of 1.8%.
9th Grade Correlation Summary
| Measurement | Barbadian | Immigrants from Ecuador |
| Minimum | 85.9% | 79.8% |
| Maximum | 100.0% | 98.4% |
| Range | 14.1% | 18.6% |
| Mean | 94.7% | 90.3% |
| Median | 94.7% | 90.7% |
| Interquartile 25% (IQ1) | 93.2% | 88.4% |
| Interquartile 75% (IQ3) | 96.7% | 93.0% |
| Interquartile Range (IQR) | 3.5% | 4.6% |
| Standard Deviation (Sample) | 3.0% | 3.9% |
| Standard Deviation (Population) | 3.0% | 3.9% |
Similar Demographics by 9th Grade
Demographics Similar to Barbadians by 9th Grade
In terms of 9th grade, the demographic groups most similar to Barbadians are Malaysian (93.5%, a difference of 0.020%), Immigrants from Trinidad and Tobago (93.6%, a difference of 0.070%), Bangladeshi (93.4%, a difference of 0.070%), Taiwanese (93.6%, a difference of 0.11%), and Immigrants from Peru (93.4%, a difference of 0.11%).
| Demographics | Rating | Rank | 9th Grade |
| West Indians | 0.2 /100 | #276 | Tragic 93.7% |
| Immigrants | Philippines | 0.1 /100 | #277 | Tragic 93.7% |
| Immigrants | Eritrea | 0.1 /100 | #278 | Tragic 93.7% |
| Trinidadians and Tobagonians | 0.1 /100 | #279 | Tragic 93.7% |
| Taiwanese | 0.1 /100 | #280 | Tragic 93.6% |
| Immigrants | Trinidad and Tobago | 0.1 /100 | #281 | Tragic 93.6% |
| Malaysians | 0.0 /100 | #282 | Tragic 93.5% |
| Barbadians | 0.0 /100 | #283 | Tragic 93.5% |
| Bangladeshis | 0.0 /100 | #284 | Tragic 93.4% |
| Immigrants | Peru | 0.0 /100 | #285 | Tragic 93.4% |
| Immigrants | Barbados | 0.0 /100 | #286 | Tragic 93.4% |
| Immigrants | St. Vincent and the Grenadines | 0.0 /100 | #287 | Tragic 93.4% |
| Immigrants | South Eastern Asia | 0.0 /100 | #288 | Tragic 93.3% |
| Immigrants | West Indies | 0.0 /100 | #289 | Tragic 93.3% |
| Pennsylvania Germans | 0.0 /100 | #290 | Tragic 93.3% |
Demographics Similar to Immigrants from Ecuador by 9th Grade
In terms of 9th grade, the demographic groups most similar to Immigrants from Ecuador are Belizean (91.8%, a difference of 0.030%), Puerto Rican (91.8%, a difference of 0.030%), Nicaraguan (91.9%, a difference of 0.070%), Immigrants from Belize (91.8%, a difference of 0.090%), and Ecuadorian (91.9%, a difference of 0.11%).
| Demographics | Rating | Rank | 9th Grade |
| Immigrants | Portugal | 0.0 /100 | #314 | Tragic 92.2% |
| Immigrants | Caribbean | 0.0 /100 | #315 | Tragic 92.2% |
| Cape Verdeans | 0.0 /100 | #316 | Tragic 92.2% |
| Immigrants | Cuba | 0.0 /100 | #317 | Tragic 92.2% |
| Nepalese | 0.0 /100 | #318 | Tragic 92.0% |
| Ecuadorians | 0.0 /100 | #319 | Tragic 91.9% |
| Nicaraguans | 0.0 /100 | #320 | Tragic 91.9% |
| Immigrants | Ecuador | 0.0 /100 | #321 | Tragic 91.8% |
| Belizeans | 0.0 /100 | #322 | Tragic 91.8% |
| Puerto Ricans | 0.0 /100 | #323 | Tragic 91.8% |
| Immigrants | Belize | 0.0 /100 | #324 | Tragic 91.8% |
| Central American Indians | 0.0 /100 | #325 | Tragic 91.5% |
| Immigrants | Armenia | 0.0 /100 | #326 | Tragic 91.4% |
| Immigrants | Nicaragua | 0.0 /100 | #327 | Tragic 91.3% |
| Dominicans | 0.0 /100 | #328 | Tragic 91.1% |