Barbadian vs Immigrants from Iran 9th Grade
COMPARE
Barbadian
Immigrants from Iran
9th Grade
9th Grade Comparison
Barbadians
Immigrants from Iran
93.5%
9TH GRADE
0.0/ 100
METRIC RATING
283rd/ 347
METRIC RANK
95.2%
9TH GRADE
88.3/ 100
METRIC RATING
136th/ 347
METRIC RANK
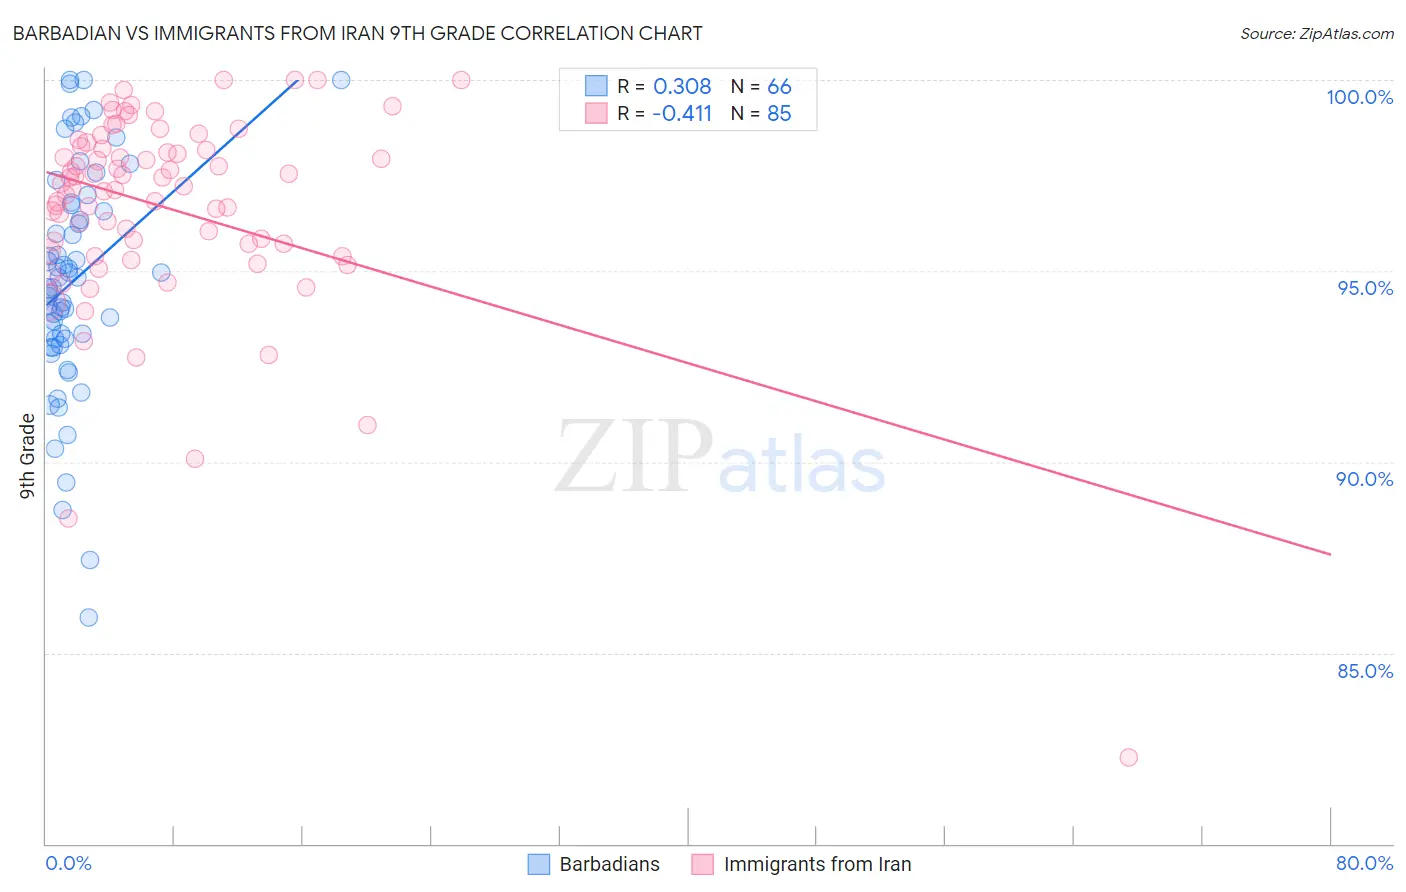
Barbadian vs Immigrants from Iran 9th Grade Correlation Chart
The statistical analysis conducted on geographies consisting of 141,304,456 people shows a mild positive correlation between the proportion of Barbadians and percentage of population with at least 9th grade education in the United States with a correlation coefficient (R) of 0.308 and weighted average of 93.5%. Similarly, the statistical analysis conducted on geographies consisting of 279,849,108 people shows a moderate negative correlation between the proportion of Immigrants from Iran and percentage of population with at least 9th grade education in the United States with a correlation coefficient (R) of -0.411 and weighted average of 95.2%, a difference of 1.8%.
9th Grade Correlation Summary
| Measurement | Barbadian | Immigrants from Iran |
| Minimum | 85.9% | 82.3% |
| Maximum | 100.0% | 100.0% |
| Range | 14.1% | 17.7% |
| Mean | 94.7% | 96.7% |
| Median | 94.7% | 97.2% |
| Interquartile 25% (IQ1) | 93.2% | 95.6% |
| Interquartile 75% (IQ3) | 96.7% | 98.2% |
| Interquartile Range (IQR) | 3.5% | 2.6% |
| Standard Deviation (Sample) | 3.0% | 2.7% |
| Standard Deviation (Population) | 3.0% | 2.7% |
Similar Demographics by 9th Grade
Demographics Similar to Barbadians by 9th Grade
In terms of 9th grade, the demographic groups most similar to Barbadians are Malaysian (93.5%, a difference of 0.020%), Immigrants from Trinidad and Tobago (93.6%, a difference of 0.070%), Bangladeshi (93.4%, a difference of 0.070%), Taiwanese (93.6%, a difference of 0.11%), and Immigrants from Peru (93.4%, a difference of 0.11%).
| Demographics | Rating | Rank | 9th Grade |
| West Indians | 0.2 /100 | #276 | Tragic 93.7% |
| Immigrants | Philippines | 0.1 /100 | #277 | Tragic 93.7% |
| Immigrants | Eritrea | 0.1 /100 | #278 | Tragic 93.7% |
| Trinidadians and Tobagonians | 0.1 /100 | #279 | Tragic 93.7% |
| Taiwanese | 0.1 /100 | #280 | Tragic 93.6% |
| Immigrants | Trinidad and Tobago | 0.1 /100 | #281 | Tragic 93.6% |
| Malaysians | 0.0 /100 | #282 | Tragic 93.5% |
| Barbadians | 0.0 /100 | #283 | Tragic 93.5% |
| Bangladeshis | 0.0 /100 | #284 | Tragic 93.4% |
| Immigrants | Peru | 0.0 /100 | #285 | Tragic 93.4% |
| Immigrants | Barbados | 0.0 /100 | #286 | Tragic 93.4% |
| Immigrants | St. Vincent and the Grenadines | 0.0 /100 | #287 | Tragic 93.4% |
| Immigrants | South Eastern Asia | 0.0 /100 | #288 | Tragic 93.3% |
| Immigrants | West Indies | 0.0 /100 | #289 | Tragic 93.3% |
| Pennsylvania Germans | 0.0 /100 | #290 | Tragic 93.3% |
Demographics Similar to Immigrants from Iran by 9th Grade
In terms of 9th grade, the demographic groups most similar to Immigrants from Iran are Immigrants from Belarus (95.2%, a difference of 0.010%), Hmong (95.2%, a difference of 0.010%), Immigrants from Israel (95.3%, a difference of 0.020%), Immigrants from Russia (95.2%, a difference of 0.030%), and Israeli (95.3%, a difference of 0.040%).
| Demographics | Rating | Rank | 9th Grade |
| Basques | 94.1 /100 | #129 | Exceptional 95.4% |
| Jordanians | 93.5 /100 | #130 | Exceptional 95.3% |
| Immigrants | North Macedonia | 92.3 /100 | #131 | Exceptional 95.3% |
| Immigrants | Nonimmigrants | 92.0 /100 | #132 | Exceptional 95.3% |
| Israelis | 90.4 /100 | #133 | Exceptional 95.3% |
| Immigrants | Israel | 89.6 /100 | #134 | Excellent 95.3% |
| Immigrants | Belarus | 88.9 /100 | #135 | Excellent 95.2% |
| Immigrants | Iran | 88.3 /100 | #136 | Excellent 95.2% |
| Hmong | 87.7 /100 | #137 | Excellent 95.2% |
| Immigrants | Russia | 86.6 /100 | #138 | Excellent 95.2% |
| Immigrants | Eastern Europe | 85.8 /100 | #139 | Excellent 95.2% |
| Immigrants | Taiwan | 85.3 /100 | #140 | Excellent 95.2% |
| Immigrants | Bosnia and Herzegovina | 85.2 /100 | #141 | Excellent 95.2% |
| Immigrants | Greece | 84.6 /100 | #142 | Excellent 95.2% |
| Spanish | 84.4 /100 | #143 | Excellent 95.2% |