Guamanian/Chamorro vs Immigrants from Scotland 9th Grade
COMPARE
Guamanian/Chamorro
Immigrants from Scotland
9th Grade
9th Grade Comparison
Guamanians/Chamorros
Immigrants from Scotland
94.8%
9TH GRADE
35.5/ 100
METRIC RATING
187th/ 347
METRIC RANK
96.1%
9TH GRADE
99.9/ 100
METRIC RATING
38th/ 347
METRIC RANK
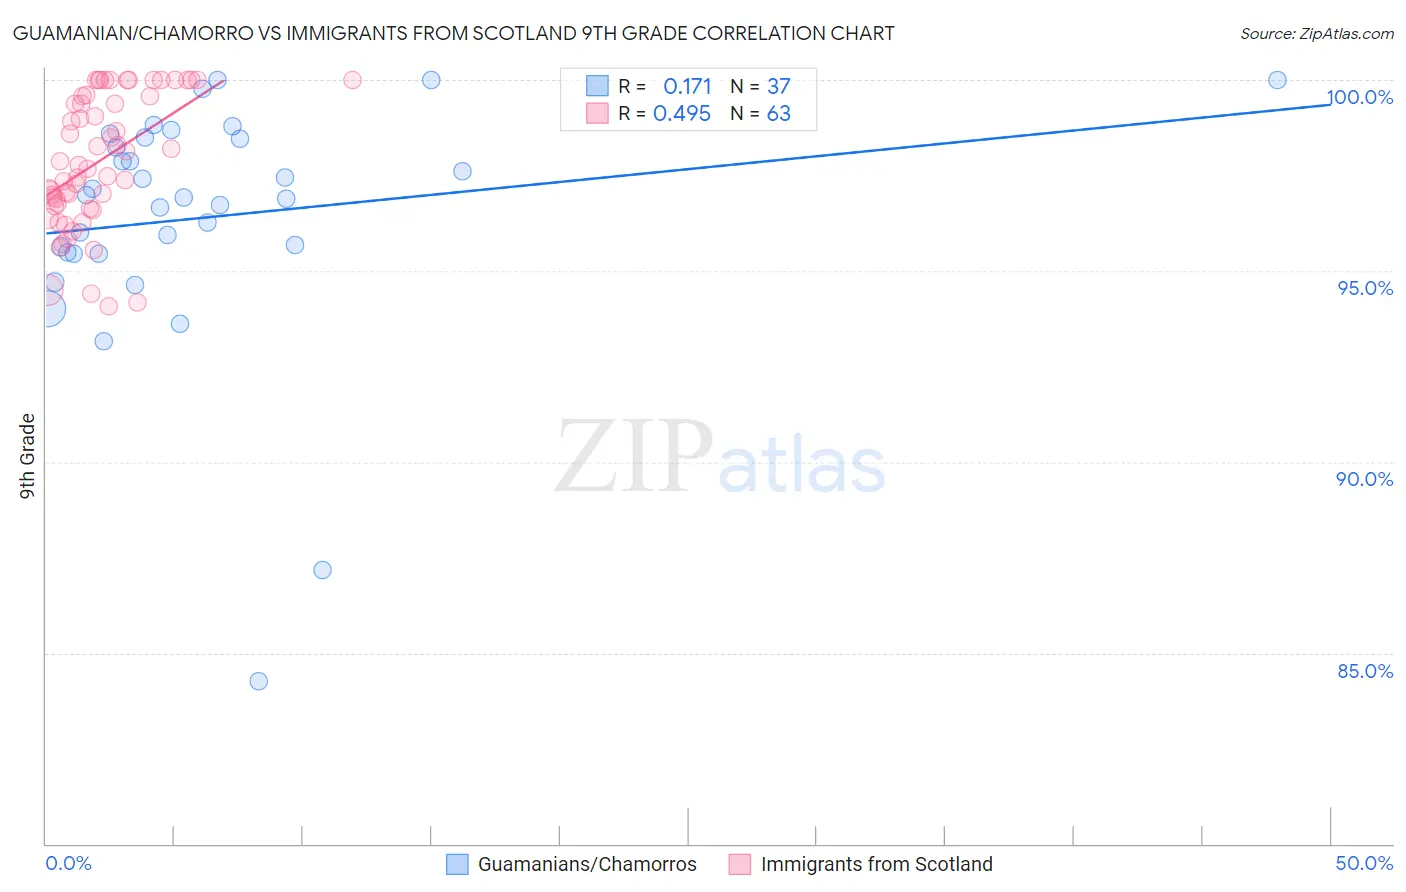
Guamanian/Chamorro vs Immigrants from Scotland 9th Grade Correlation Chart
The statistical analysis conducted on geographies consisting of 221,965,618 people shows a poor positive correlation between the proportion of Guamanians/Chamorros and percentage of population with at least 9th grade education in the United States with a correlation coefficient (R) of 0.171 and weighted average of 94.8%. Similarly, the statistical analysis conducted on geographies consisting of 196,394,967 people shows a moderate positive correlation between the proportion of Immigrants from Scotland and percentage of population with at least 9th grade education in the United States with a correlation coefficient (R) of 0.495 and weighted average of 96.1%, a difference of 1.5%.
9th Grade Correlation Summary
| Measurement | Guamanian/Chamorro | Immigrants from Scotland |
| Minimum | 84.3% | 94.1% |
| Maximum | 100.0% | 100.0% |
| Range | 15.7% | 5.9% |
| Mean | 96.4% | 97.9% |
| Median | 96.9% | 97.8% |
| Interquartile 25% (IQ1) | 95.5% | 96.7% |
| Interquartile 75% (IQ3) | 98.5% | 99.6% |
| Interquartile Range (IQR) | 3.0% | 2.9% |
| Standard Deviation (Sample) | 3.2% | 1.7% |
| Standard Deviation (Population) | 3.1% | 1.7% |
Similar Demographics by 9th Grade
Demographics Similar to Guamanians/Chamorros by 9th Grade
In terms of 9th grade, the demographic groups most similar to Guamanians/Chamorros are Hopi (94.8%, a difference of 0.010%), Immigrants from Albania (94.8%, a difference of 0.010%), Immigrants from Argentina (94.8%, a difference of 0.010%), Argentinean (94.8%, a difference of 0.020%), and Liberian (94.8%, a difference of 0.020%).
| Demographics | Rating | Rank | 9th Grade |
| Immigrants | Uganda | 43.1 /100 | #180 | Average 94.8% |
| Sierra Leoneans | 42.7 /100 | #181 | Average 94.8% |
| Seminole | 42.5 /100 | #182 | Average 94.8% |
| Immigrants | Nepal | 39.7 /100 | #183 | Fair 94.8% |
| Argentineans | 37.6 /100 | #184 | Fair 94.8% |
| Liberians | 37.4 /100 | #185 | Fair 94.8% |
| Hopi | 37.1 /100 | #186 | Fair 94.8% |
| Guamanians/Chamorros | 35.5 /100 | #187 | Fair 94.8% |
| Immigrants | Albania | 34.5 /100 | #188 | Fair 94.8% |
| Immigrants | Argentina | 34.4 /100 | #189 | Fair 94.8% |
| Sudanese | 32.7 /100 | #190 | Fair 94.7% |
| Assyrians/Chaldeans/Syriacs | 32.0 /100 | #191 | Fair 94.7% |
| Immigrants | Northern Africa | 30.7 /100 | #192 | Fair 94.7% |
| Paraguayans | 30.1 /100 | #193 | Fair 94.7% |
| Panamanians | 29.0 /100 | #194 | Fair 94.7% |
Demographics Similar to Immigrants from Scotland by 9th Grade
In terms of 9th grade, the demographic groups most similar to Immigrants from Scotland are Estonian (96.1%, a difference of 0.0%), Ottawa (96.1%, a difference of 0.020%), Northern European (96.2%, a difference of 0.040%), Slavic (96.1%, a difference of 0.040%), and Bulgarian (96.2%, a difference of 0.050%).
| Demographics | Rating | Rank | 9th Grade |
| British | 100.0 /100 | #31 | Exceptional 96.3% |
| Belgians | 100.0 /100 | #32 | Exceptional 96.3% |
| Luxembourgers | 100.0 /100 | #33 | Exceptional 96.3% |
| Hungarians | 100.0 /100 | #34 | Exceptional 96.2% |
| Bulgarians | 99.9 /100 | #35 | Exceptional 96.2% |
| Northern Europeans | 99.9 /100 | #36 | Exceptional 96.2% |
| Estonians | 99.9 /100 | #37 | Exceptional 96.1% |
| Immigrants | Scotland | 99.9 /100 | #38 | Exceptional 96.1% |
| Ottawa | 99.9 /100 | #39 | Exceptional 96.1% |
| Slavs | 99.9 /100 | #40 | Exceptional 96.1% |
| Czechoslovakians | 99.9 /100 | #41 | Exceptional 96.1% |
| Chippewa | 99.9 /100 | #42 | Exceptional 96.1% |
| Iranians | 99.9 /100 | #43 | Exceptional 96.1% |
| Alaska Natives | 99.9 /100 | #44 | Exceptional 96.1% |
| Crow | 99.9 /100 | #45 | Exceptional 96.1% |