Bangladeshi vs Spaniard Female Disability
COMPARE
Bangladeshi
Spaniard
Female Disability
Female Disability Comparison
Bangladeshis
Spaniards
13.1%
FEMALE DISABILITY
0.0/ 100
METRIC RATING
285th/ 347
METRIC RANK
12.8%
FEMALE DISABILITY
0.7/ 100
METRIC RATING
263rd/ 347
METRIC RANK
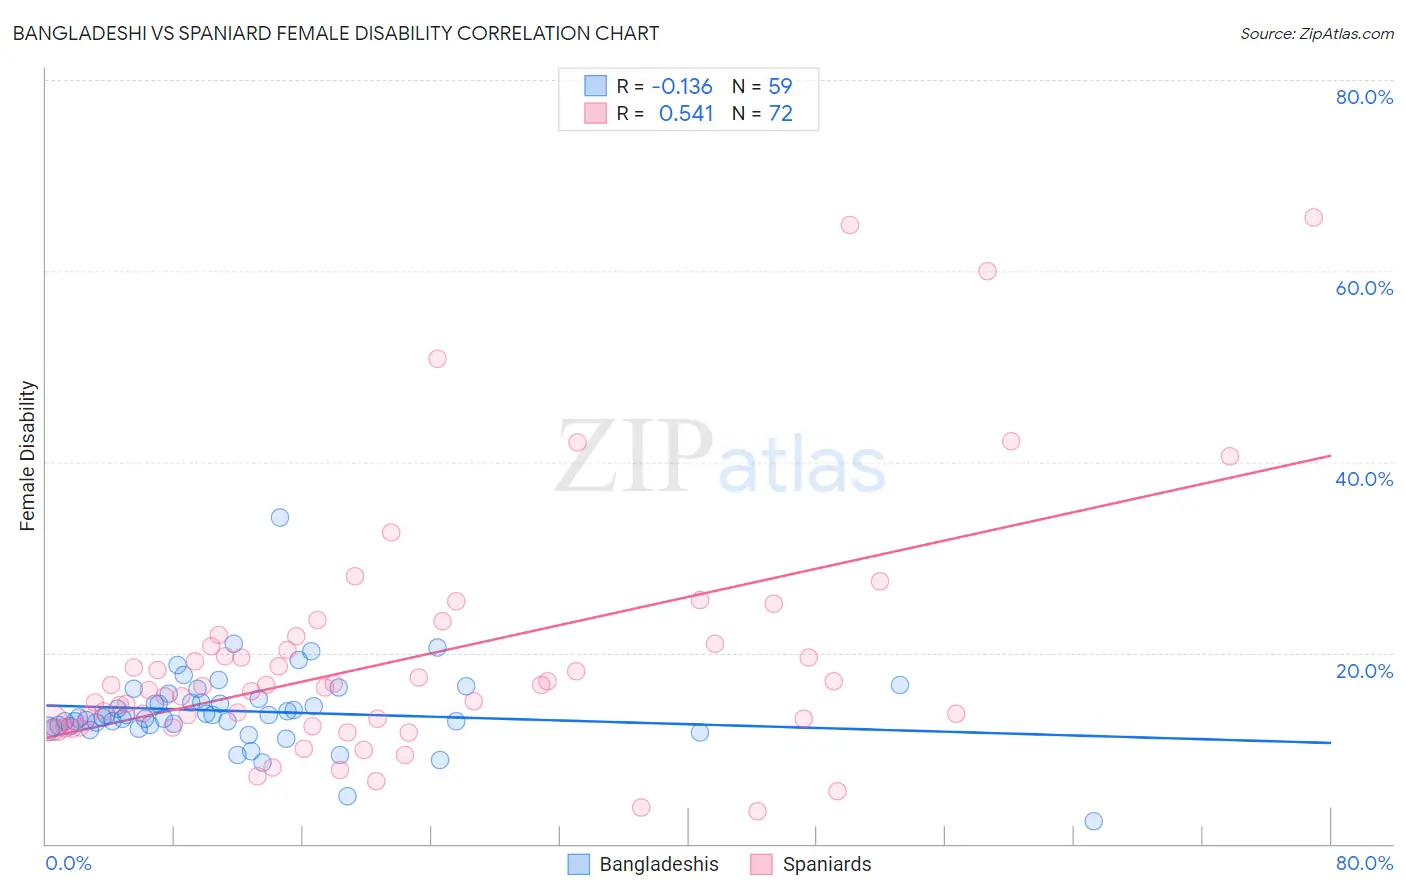
Bangladeshi vs Spaniard Female Disability Correlation Chart
The statistical analysis conducted on geographies consisting of 141,386,461 people shows a poor negative correlation between the proportion of Bangladeshis and percentage of females with a disability in the United States with a correlation coefficient (R) of -0.136 and weighted average of 13.1%. Similarly, the statistical analysis conducted on geographies consisting of 443,418,073 people shows a substantial positive correlation between the proportion of Spaniards and percentage of females with a disability in the United States with a correlation coefficient (R) of 0.541 and weighted average of 12.8%, a difference of 2.6%.
Female Disability Correlation Summary
| Measurement | Bangladeshi | Spaniard |
| Minimum | 2.3% | 3.4% |
| Maximum | 34.2% | 65.6% |
| Range | 31.9% | 62.2% |
| Mean | 13.9% | 19.4% |
| Median | 13.3% | 16.4% |
| Interquartile 25% (IQ1) | 12.4% | 12.5% |
| Interquartile 75% (IQ3) | 15.2% | 20.8% |
| Interquartile Range (IQR) | 2.8% | 8.3% |
| Standard Deviation (Sample) | 4.2% | 12.6% |
| Standard Deviation (Population) | 4.2% | 12.5% |
Similar Demographics by Female Disability
Demographics Similar to Bangladeshis by Female Disability
In terms of female disability, the demographic groups most similar to Bangladeshis are Hmong (13.1%, a difference of 0.050%), Fijian (13.1%, a difference of 0.050%), English (13.1%, a difference of 0.18%), Welsh (13.1%, a difference of 0.19%), and U.S. Virgin Islander (13.1%, a difference of 0.27%).
| Demographics | Rating | Rank | Female Disability |
| Scottish | 0.1 /100 | #278 | Tragic 13.0% |
| Arapaho | 0.1 /100 | #279 | Tragic 13.0% |
| Irish | 0.1 /100 | #280 | Tragic 13.1% |
| U.S. Virgin Islanders | 0.1 /100 | #281 | Tragic 13.1% |
| Welsh | 0.0 /100 | #282 | Tragic 13.1% |
| English | 0.0 /100 | #283 | Tragic 13.1% |
| Hmong | 0.0 /100 | #284 | Tragic 13.1% |
| Bangladeshis | 0.0 /100 | #285 | Tragic 13.1% |
| Fijians | 0.0 /100 | #286 | Tragic 13.1% |
| Yaqui | 0.0 /100 | #287 | Tragic 13.2% |
| Whites/Caucasians | 0.0 /100 | #288 | Tragic 13.2% |
| Tlingit-Haida | 0.0 /100 | #289 | Tragic 13.2% |
| Immigrants | Yemen | 0.0 /100 | #290 | Tragic 13.2% |
| Shoshone | 0.0 /100 | #291 | Tragic 13.2% |
| Yakama | 0.0 /100 | #292 | Tragic 13.2% |
Demographics Similar to Spaniards by Female Disability
In terms of female disability, the demographic groups most similar to Spaniards are Alaska Native (12.8%, a difference of 0.12%), Czechoslovakian (12.7%, a difference of 0.23%), Bermudan (12.7%, a difference of 0.30%), West Indian (12.8%, a difference of 0.31%), and Subsaharan African (12.7%, a difference of 0.34%).
| Demographics | Rating | Rank | Female Disability |
| British West Indians | 1.2 /100 | #256 | Tragic 12.7% |
| Liberians | 1.1 /100 | #257 | Tragic 12.7% |
| Aleuts | 1.1 /100 | #258 | Tragic 12.7% |
| Immigrants | Armenia | 1.0 /100 | #259 | Tragic 12.7% |
| Sub-Saharan Africans | 1.0 /100 | #260 | Tragic 12.7% |
| Bermudans | 1.0 /100 | #261 | Tragic 12.7% |
| Czechoslovakians | 0.9 /100 | #262 | Tragic 12.7% |
| Spaniards | 0.7 /100 | #263 | Tragic 12.8% |
| Alaska Natives | 0.6 /100 | #264 | Tragic 12.8% |
| West Indians | 0.5 /100 | #265 | Tragic 12.8% |
| Finns | 0.4 /100 | #266 | Tragic 12.8% |
| Senegalese | 0.4 /100 | #267 | Tragic 12.8% |
| Immigrants | Laos | 0.4 /100 | #268 | Tragic 12.8% |
| Indonesians | 0.4 /100 | #269 | Tragic 12.8% |
| Immigrants | Liberia | 0.3 /100 | #270 | Tragic 12.9% |