Immigrants from Trinidad and Tobago vs Immigrants from Moldova College, 1 year or more
COMPARE
Immigrants from Trinidad and Tobago
Immigrants from Moldova
College, 1 year or more
College, 1 year or more Comparison
Immigrants from Trinidad and Tobago
Immigrants from Moldova
55.5%
COLLEGE, 1 YEAR OR MORE
0.7/ 100
METRIC RATING
249th/ 347
METRIC RANK
63.0%
COLLEGE, 1 YEAR OR MORE
99.0/ 100
METRIC RATING
73rd/ 347
METRIC RANK
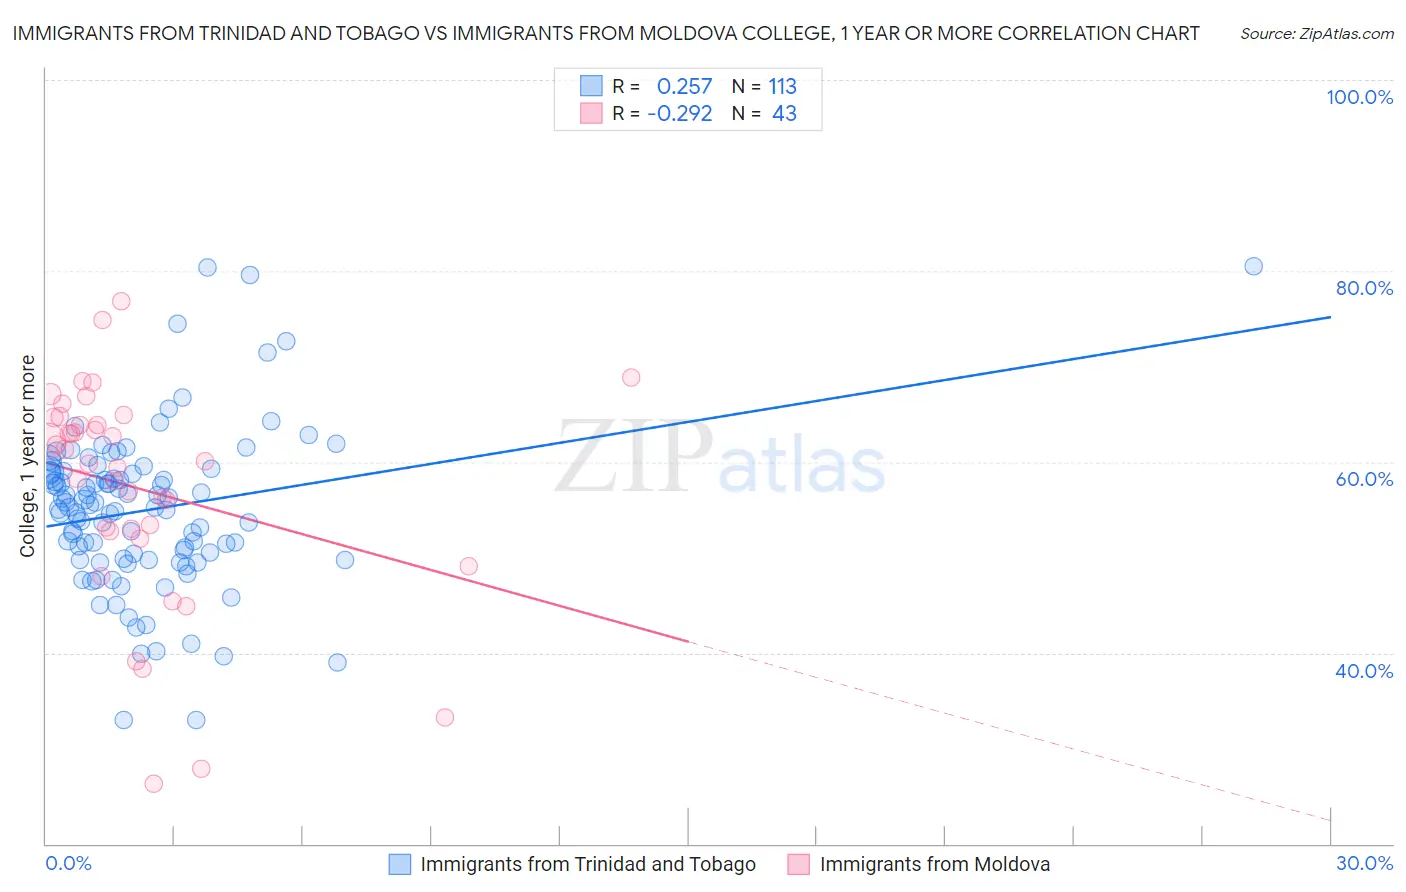
Immigrants from Trinidad and Tobago vs Immigrants from Moldova College, 1 year or more Correlation Chart
The statistical analysis conducted on geographies consisting of 223,526,872 people shows a weak positive correlation between the proportion of Immigrants from Trinidad and Tobago and percentage of population with at least college, 1 year or more education in the United States with a correlation coefficient (R) of 0.257 and weighted average of 55.5%. Similarly, the statistical analysis conducted on geographies consisting of 124,398,509 people shows a weak negative correlation between the proportion of Immigrants from Moldova and percentage of population with at least college, 1 year or more education in the United States with a correlation coefficient (R) of -0.292 and weighted average of 63.0%, a difference of 13.6%.
College, 1 year or more Correlation Summary
| Measurement | Immigrants from Trinidad and Tobago | Immigrants from Moldova |
| Minimum | 32.9% | 26.3% |
| Maximum | 80.5% | 76.8% |
| Range | 47.6% | 50.4% |
| Mean | 54.9% | 57.2% |
| Median | 55.2% | 60.0% |
| Interquartile 25% (IQ1) | 49.8% | 52.7% |
| Interquartile 75% (IQ3) | 58.9% | 64.6% |
| Interquartile Range (IQR) | 9.1% | 12.0% |
| Standard Deviation (Sample) | 8.3% | 11.4% |
| Standard Deviation (Population) | 8.3% | 11.3% |
Similar Demographics by College, 1 year or more
Demographics Similar to Immigrants from Trinidad and Tobago by College, 1 year or more
In terms of college, 1 year or more, the demographic groups most similar to Immigrants from Trinidad and Tobago are Delaware (55.5%, a difference of 0.020%), Immigrants from Congo (55.6%, a difference of 0.10%), Immigrants from Cambodia (55.4%, a difference of 0.11%), Hawaiian (55.6%, a difference of 0.13%), and Aleut (55.4%, a difference of 0.14%).
| Demographics | Rating | Rank | College, 1 year or more |
| Marshallese | 1.0 /100 | #242 | Tragic 55.8% |
| Osage | 1.0 /100 | #243 | Tragic 55.8% |
| Chippewa | 0.9 /100 | #244 | Tragic 55.7% |
| Immigrants | Liberia | 0.8 /100 | #245 | Tragic 55.7% |
| Malaysians | 0.8 /100 | #246 | Tragic 55.6% |
| Hawaiians | 0.8 /100 | #247 | Tragic 55.6% |
| Immigrants | Congo | 0.8 /100 | #248 | Tragic 55.6% |
| Immigrants | Trinidad and Tobago | 0.7 /100 | #249 | Tragic 55.5% |
| Delaware | 0.7 /100 | #250 | Tragic 55.5% |
| Immigrants | Cambodia | 0.6 /100 | #251 | Tragic 55.4% |
| Aleuts | 0.6 /100 | #252 | Tragic 55.4% |
| Immigrants | Barbados | 0.6 /100 | #253 | Tragic 55.4% |
| Japanese | 0.5 /100 | #254 | Tragic 55.2% |
| Immigrants | Bahamas | 0.5 /100 | #255 | Tragic 55.2% |
| Immigrants | West Indies | 0.5 /100 | #256 | Tragic 55.2% |
Demographics Similar to Immigrants from Moldova by College, 1 year or more
In terms of college, 1 year or more, the demographic groups most similar to Immigrants from Moldova are Egyptian (63.1%, a difference of 0.010%), Immigrants from North America (63.0%, a difference of 0.020%), Immigrants from Canada (63.1%, a difference of 0.070%), Armenian (63.0%, a difference of 0.11%), and Paraguayan (62.9%, a difference of 0.21%).
| Demographics | Rating | Rank | College, 1 year or more |
| Immigrants | Europe | 99.3 /100 | #66 | Exceptional 63.3% |
| Immigrants | Romania | 99.3 /100 | #67 | Exceptional 63.3% |
| Immigrants | Greece | 99.3 /100 | #68 | Exceptional 63.3% |
| Immigrants | Zimbabwe | 99.3 /100 | #69 | Exceptional 63.3% |
| Argentineans | 99.2 /100 | #70 | Exceptional 63.2% |
| Immigrants | Canada | 99.1 /100 | #71 | Exceptional 63.1% |
| Egyptians | 99.0 /100 | #72 | Exceptional 63.1% |
| Immigrants | Moldova | 99.0 /100 | #73 | Exceptional 63.0% |
| Immigrants | North America | 99.0 /100 | #74 | Exceptional 63.0% |
| Armenians | 98.9 /100 | #75 | Exceptional 63.0% |
| Paraguayans | 98.8 /100 | #76 | Exceptional 62.9% |
| Ethiopians | 98.8 /100 | #77 | Exceptional 62.9% |
| Immigrants | Lebanon | 98.8 /100 | #78 | Exceptional 62.9% |
| Northern Europeans | 98.8 /100 | #79 | Exceptional 62.9% |
| Lithuanians | 98.8 /100 | #80 | Exceptional 62.9% |