Bahamian vs Immigrants from Moldova Family Households
COMPARE
Bahamian
Immigrants from Moldova
Family Households
Family Households Comparison
Bahamians
Immigrants from Moldova
63.3%
FAMILY HOUSEHOLDS
1.1/ 100
METRIC RATING
252nd/ 347
METRIC RANK
64.4%
FAMILY HOUSEHOLDS
65.2/ 100
METRIC RATING
160th/ 347
METRIC RANK
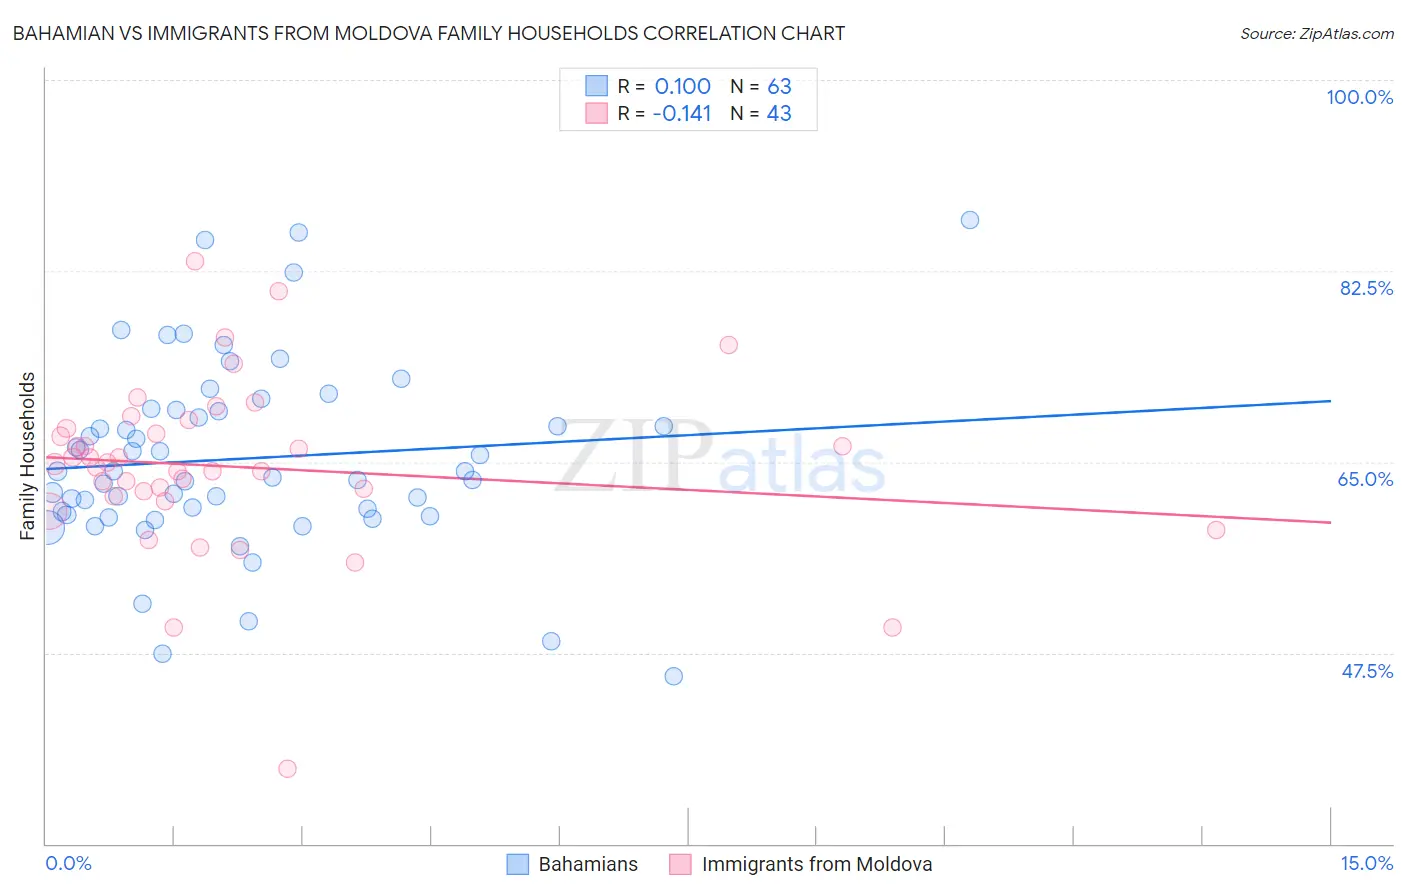
Bahamian vs Immigrants from Moldova Family Households Correlation Chart
The statistical analysis conducted on geographies consisting of 112,635,727 people shows a slight positive correlation between the proportion of Bahamians and percentage of family households in the United States with a correlation coefficient (R) of 0.100 and weighted average of 63.3%. Similarly, the statistical analysis conducted on geographies consisting of 124,364,803 people shows a poor negative correlation between the proportion of Immigrants from Moldova and percentage of family households in the United States with a correlation coefficient (R) of -0.141 and weighted average of 64.4%, a difference of 1.7%.
Family Households Correlation Summary
| Measurement | Bahamian | Immigrants from Moldova |
| Minimum | 45.4% | 36.9% |
| Maximum | 87.2% | 83.4% |
| Range | 41.8% | 46.5% |
| Mean | 65.3% | 64.5% |
| Median | 64.1% | 64.8% |
| Interquartile 25% (IQ1) | 60.1% | 61.9% |
| Interquartile 75% (IQ3) | 69.7% | 68.1% |
| Interquartile Range (IQR) | 9.6% | 6.2% |
| Standard Deviation (Sample) | 8.6% | 8.0% |
| Standard Deviation (Population) | 8.5% | 7.9% |
Similar Demographics by Family Households
Demographics Similar to Bahamians by Family Households
In terms of family households, the demographic groups most similar to Bahamians are Taiwanese (63.3%, a difference of 0.010%), Immigrants from Dominican Republic (63.3%, a difference of 0.020%), Slovak (63.3%, a difference of 0.030%), Potawatomi (63.3%, a difference of 0.050%), and Immigrants from Japan (63.4%, a difference of 0.070%).
| Demographics | Rating | Rank | Family Households |
| Immigrants | Dominica | 1.6 /100 | #245 | Tragic 63.4% |
| Immigrants | Ghana | 1.6 /100 | #246 | Tragic 63.4% |
| Immigrants | Uzbekistan | 1.5 /100 | #247 | Tragic 63.4% |
| Dominicans | 1.5 /100 | #248 | Tragic 63.4% |
| Russians | 1.4 /100 | #249 | Tragic 63.4% |
| Immigrants | Japan | 1.4 /100 | #250 | Tragic 63.4% |
| Taiwanese | 1.2 /100 | #251 | Tragic 63.3% |
| Bahamians | 1.1 /100 | #252 | Tragic 63.3% |
| Immigrants | Dominican Republic | 1.0 /100 | #253 | Tragic 63.3% |
| Slovaks | 1.0 /100 | #254 | Tragic 63.3% |
| Potawatomi | 1.0 /100 | #255 | Tragic 63.3% |
| Luxembourgers | 0.9 /100 | #256 | Tragic 63.3% |
| Icelanders | 0.8 /100 | #257 | Tragic 63.3% |
| Immigrants | Barbados | 0.7 /100 | #258 | Tragic 63.2% |
| Immigrants | Western Europe | 0.6 /100 | #259 | Tragic 63.2% |
Demographics Similar to Immigrants from Moldova by Family Households
In terms of family households, the demographic groups most similar to Immigrants from Moldova are German (64.4%, a difference of 0.010%), Canadian (64.4%, a difference of 0.020%), Lebanese (64.4%, a difference of 0.020%), Czech (64.5%, a difference of 0.030%), and Uruguayan (64.5%, a difference of 0.040%).
| Demographics | Rating | Rank | Family Households |
| Swedes | 69.8 /100 | #153 | Good 64.5% |
| Austrians | 68.5 /100 | #154 | Good 64.5% |
| Uruguayans | 67.7 /100 | #155 | Good 64.5% |
| Czechs | 67.0 /100 | #156 | Good 64.5% |
| Canadians | 66.6 /100 | #157 | Good 64.4% |
| Lebanese | 66.4 /100 | #158 | Good 64.4% |
| Germans | 65.8 /100 | #159 | Good 64.4% |
| Immigrants | Moldova | 65.2 /100 | #160 | Good 64.4% |
| Immigrants | England | 62.6 /100 | #161 | Good 64.4% |
| British | 61.6 /100 | #162 | Good 64.4% |
| Chickasaw | 61.5 /100 | #163 | Good 64.4% |
| Immigrants | Nigeria | 60.1 /100 | #164 | Good 64.4% |
| Immigrants | Southern Europe | 60.0 /100 | #165 | Good 64.4% |
| Scotch-Irish | 59.2 /100 | #166 | Average 64.4% |
| Irish | 57.9 /100 | #167 | Average 64.4% |