Bahamian vs Salvadoran GED/Equivalency
COMPARE
Bahamian
Salvadoran
GED/Equivalency
GED/Equivalency Comparison
Bahamians
Salvadorans
83.6%
GED/EQUIVALENCY
0.8/ 100
METRIC RATING
252nd/ 347
METRIC RANK
78.6%
GED/EQUIVALENCY
0.0/ 100
METRIC RATING
333rd/ 347
METRIC RANK
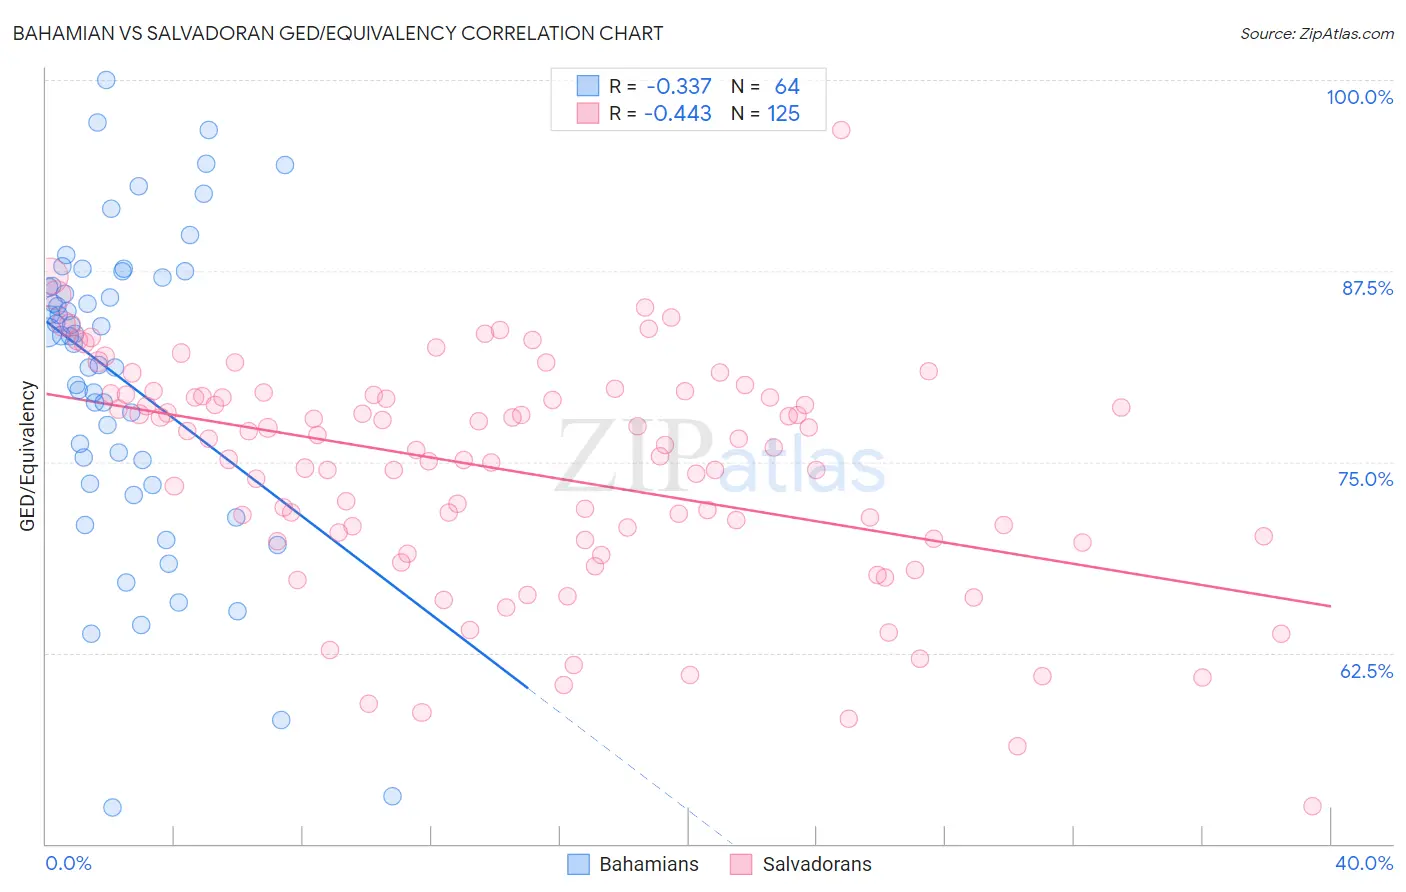
Bahamian vs Salvadoran GED/Equivalency Correlation Chart
The statistical analysis conducted on geographies consisting of 112,707,159 people shows a mild negative correlation between the proportion of Bahamians and percentage of population with at least ged/equivalency education in the United States with a correlation coefficient (R) of -0.337 and weighted average of 83.6%. Similarly, the statistical analysis conducted on geographies consisting of 399,020,036 people shows a moderate negative correlation between the proportion of Salvadorans and percentage of population with at least ged/equivalency education in the United States with a correlation coefficient (R) of -0.443 and weighted average of 78.6%, a difference of 6.4%.
GED/Equivalency Correlation Summary
| Measurement | Bahamian | Salvadoran |
| Minimum | 52.4% | 52.4% |
| Maximum | 100.0% | 96.7% |
| Range | 47.6% | 44.2% |
| Mean | 80.4% | 74.4% |
| Median | 83.2% | 76.0% |
| Interquartile 25% (IQ1) | 74.4% | 69.9% |
| Interquartile 75% (IQ3) | 86.8% | 79.3% |
| Interquartile Range (IQR) | 12.5% | 9.4% |
| Standard Deviation (Sample) | 10.2% | 7.4% |
| Standard Deviation (Population) | 10.1% | 7.4% |
Similar Demographics by GED/Equivalency
Demographics Similar to Bahamians by GED/Equivalency
In terms of ged/equivalency, the demographic groups most similar to Bahamians are Spanish American (83.6%, a difference of 0.0%), Comanche (83.6%, a difference of 0.060%), Creek (83.6%, a difference of 0.090%), Shoshone (83.7%, a difference of 0.15%), and Blackfeet (83.8%, a difference of 0.17%).
| Demographics | Rating | Rank | GED/Equivalency |
| Immigrants | Senegal | 1.2 /100 | #245 | Tragic 83.8% |
| Chickasaw | 1.2 /100 | #246 | Tragic 83.8% |
| Immigrants | Western Africa | 1.1 /100 | #247 | Tragic 83.8% |
| Blackfeet | 1.1 /100 | #248 | Tragic 83.8% |
| Crow | 1.1 /100 | #249 | Tragic 83.8% |
| Shoshone | 1.0 /100 | #250 | Tragic 83.7% |
| Spanish Americans | 0.8 /100 | #251 | Tragic 83.6% |
| Bahamians | 0.8 /100 | #252 | Tragic 83.6% |
| Comanche | 0.7 /100 | #253 | Tragic 83.6% |
| Creek | 0.7 /100 | #254 | Tragic 83.6% |
| Colville | 0.5 /100 | #255 | Tragic 83.4% |
| Africans | 0.5 /100 | #256 | Tragic 83.4% |
| Jamaicans | 0.4 /100 | #257 | Tragic 83.3% |
| Malaysians | 0.4 /100 | #258 | Tragic 83.3% |
| Immigrants | Vietnam | 0.3 /100 | #259 | Tragic 83.2% |
Demographics Similar to Salvadorans by GED/Equivalency
In terms of ged/equivalency, the demographic groups most similar to Salvadorans are Guatemalan (78.5%, a difference of 0.080%), Immigrants from the Azores (78.7%, a difference of 0.11%), Immigrants from Latin America (78.5%, a difference of 0.11%), Immigrants from Honduras (78.7%, a difference of 0.22%), and Immigrants from Cabo Verde (78.9%, a difference of 0.47%).
| Demographics | Rating | Rank | GED/Equivalency |
| Yuman | 0.0 /100 | #326 | Tragic 79.2% |
| Central Americans | 0.0 /100 | #327 | Tragic 79.2% |
| Hispanics or Latinos | 0.0 /100 | #328 | Tragic 79.1% |
| Dominicans | 0.0 /100 | #329 | Tragic 79.1% |
| Immigrants | Cabo Verde | 0.0 /100 | #330 | Tragic 78.9% |
| Immigrants | Honduras | 0.0 /100 | #331 | Tragic 78.7% |
| Immigrants | Azores | 0.0 /100 | #332 | Tragic 78.7% |
| Salvadorans | 0.0 /100 | #333 | Tragic 78.6% |
| Guatemalans | 0.0 /100 | #334 | Tragic 78.5% |
| Immigrants | Latin America | 0.0 /100 | #335 | Tragic 78.5% |
| Immigrants | Dominican Republic | 0.0 /100 | #336 | Tragic 78.0% |
| Immigrants | Yemen | 0.0 /100 | #337 | Tragic 77.9% |
| Immigrants | Guatemala | 0.0 /100 | #338 | Tragic 77.9% |
| Immigrants | El Salvador | 0.0 /100 | #339 | Tragic 77.6% |
| Tohono O'odham | 0.0 /100 | #340 | Tragic 77.5% |