Bahamian vs Immigrants from Nicaragua 11th Grade
COMPARE
Bahamian
Immigrants from Nicaragua
11th Grade
11th Grade Comparison
Bahamians
Immigrants from Nicaragua
91.6%
11TH GRADE
1.8/ 100
METRIC RATING
241st/ 347
METRIC RANK
88.1%
11TH GRADE
0.0/ 100
METRIC RATING
325th/ 347
METRIC RANK
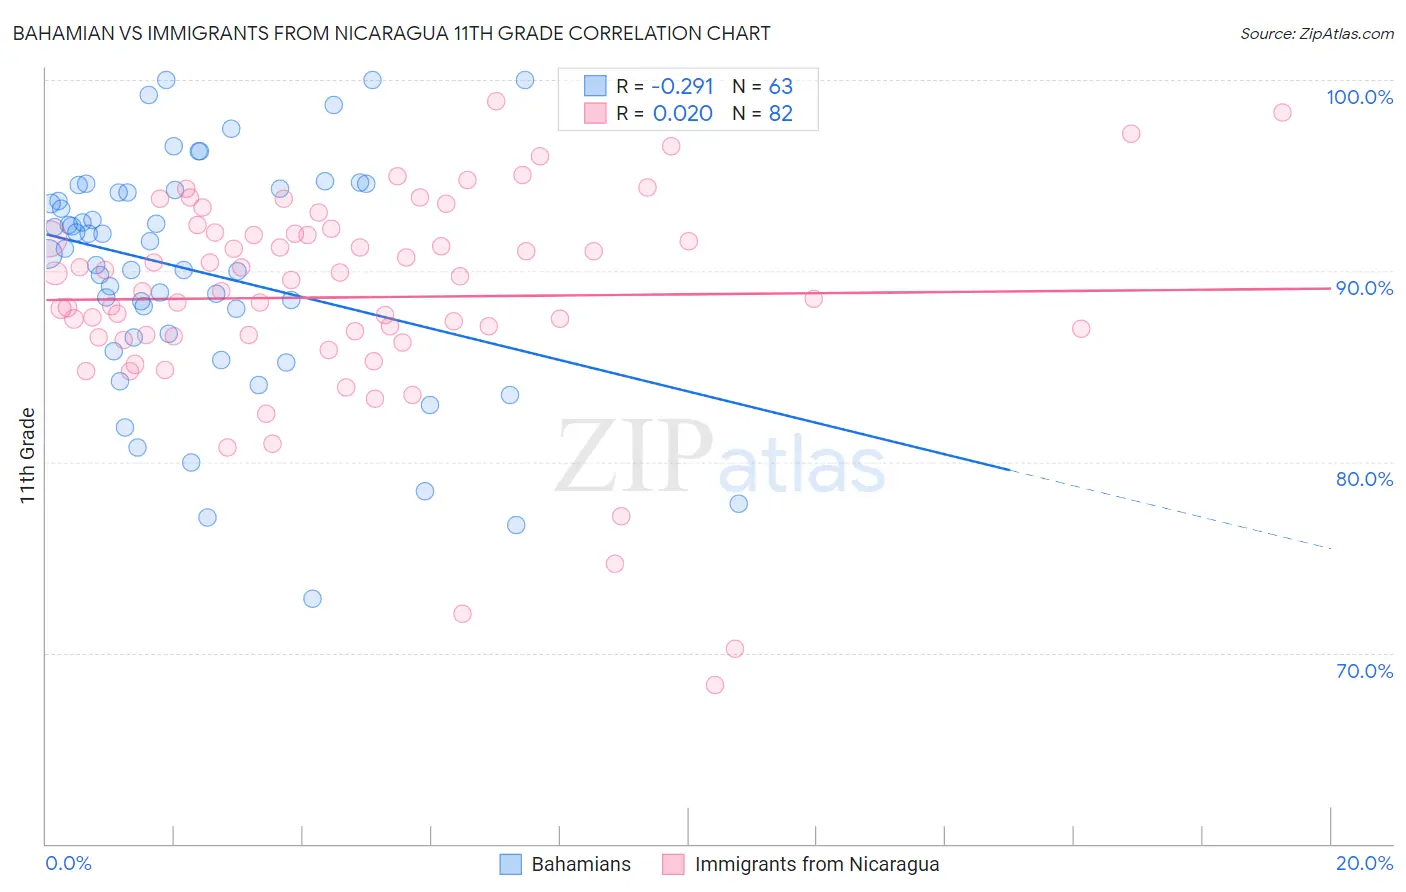
Bahamian vs Immigrants from Nicaragua 11th Grade Correlation Chart
The statistical analysis conducted on geographies consisting of 112,698,819 people shows a weak negative correlation between the proportion of Bahamians and percentage of population with at least 11th grade education in the United States with a correlation coefficient (R) of -0.291 and weighted average of 91.6%. Similarly, the statistical analysis conducted on geographies consisting of 236,340,506 people shows no correlation between the proportion of Immigrants from Nicaragua and percentage of population with at least 11th grade education in the United States with a correlation coefficient (R) of 0.020 and weighted average of 88.1%, a difference of 4.0%.
11th Grade Correlation Summary
| Measurement | Bahamian | Immigrants from Nicaragua |
| Minimum | 72.8% | 68.3% |
| Maximum | 100.0% | 98.9% |
| Range | 27.2% | 30.6% |
| Mean | 90.0% | 88.6% |
| Median | 91.2% | 89.2% |
| Interquartile 25% (IQ1) | 86.5% | 86.6% |
| Interquartile 75% (IQ3) | 94.2% | 92.0% |
| Interquartile Range (IQR) | 7.7% | 5.4% |
| Standard Deviation (Sample) | 6.1% | 5.7% |
| Standard Deviation (Population) | 6.1% | 5.6% |
Similar Demographics by 11th Grade
Demographics Similar to Bahamians by 11th Grade
In terms of 11th grade, the demographic groups most similar to Bahamians are South American (91.6%, a difference of 0.020%), Immigrants from Middle Africa (91.6%, a difference of 0.030%), Immigrants from Thailand (91.6%, a difference of 0.060%), Senegalese (91.6%, a difference of 0.070%), and Hopi (91.7%, a difference of 0.080%).
| Demographics | Rating | Rank | 11th Grade |
| Armenians | 2.9 /100 | #234 | Tragic 91.7% |
| Sub-Saharan Africans | 2.9 /100 | #235 | Tragic 91.7% |
| Colombians | 2.8 /100 | #236 | Tragic 91.7% |
| Immigrants | Bolivia | 2.8 /100 | #237 | Tragic 91.7% |
| Comanche | 2.6 /100 | #238 | Tragic 91.7% |
| Hopi | 2.5 /100 | #239 | Tragic 91.7% |
| South Americans | 2.0 /100 | #240 | Tragic 91.6% |
| Bahamians | 1.8 /100 | #241 | Tragic 91.6% |
| Immigrants | Middle Africa | 1.6 /100 | #242 | Tragic 91.6% |
| Immigrants | Thailand | 1.4 /100 | #243 | Tragic 91.6% |
| Senegalese | 1.4 /100 | #244 | Tragic 91.6% |
| Africans | 1.3 /100 | #245 | Tragic 91.5% |
| Seminole | 1.2 /100 | #246 | Tragic 91.5% |
| Immigrants | Philippines | 1.0 /100 | #247 | Tragic 91.5% |
| Immigrants | Uzbekistan | 1.0 /100 | #248 | Tragic 91.5% |
Demographics Similar to Immigrants from Nicaragua by 11th Grade
In terms of 11th grade, the demographic groups most similar to Immigrants from Nicaragua are Central American Indian (88.2%, a difference of 0.13%), Pima (88.3%, a difference of 0.17%), Puerto Rican (88.4%, a difference of 0.25%), Dominican (87.7%, a difference of 0.54%), and Immigrants from Cabo Verde (87.6%, a difference of 0.57%).
| Demographics | Rating | Rank | 11th Grade |
| Nicaraguans | 0.0 /100 | #318 | Tragic 88.9% |
| Belizeans | 0.0 /100 | #319 | Tragic 88.8% |
| Immigrants | Armenia | 0.0 /100 | #320 | Tragic 88.8% |
| Immigrants | Belize | 0.0 /100 | #321 | Tragic 88.7% |
| Puerto Ricans | 0.0 /100 | #322 | Tragic 88.4% |
| Pima | 0.0 /100 | #323 | Tragic 88.3% |
| Central American Indians | 0.0 /100 | #324 | Tragic 88.2% |
| Immigrants | Nicaragua | 0.0 /100 | #325 | Tragic 88.1% |
| Dominicans | 0.0 /100 | #326 | Tragic 87.7% |
| Immigrants | Cabo Verde | 0.0 /100 | #327 | Tragic 87.6% |
| Tohono O'odham | 0.0 /100 | #328 | Tragic 87.6% |
| Mexican American Indians | 0.0 /100 | #329 | Tragic 87.5% |
| Hondurans | 0.0 /100 | #330 | Tragic 87.4% |
| Hispanics or Latinos | 0.0 /100 | #331 | Tragic 87.3% |
| Immigrants | Azores | 0.0 /100 | #332 | Tragic 87.2% |