Bahamian vs Immigrants from South Africa 11th Grade
COMPARE
Bahamian
Immigrants from South Africa
11th Grade
11th Grade Comparison
Bahamians
Immigrants from South Africa
91.6%
11TH GRADE
1.8/ 100
METRIC RATING
241st/ 347
METRIC RANK
93.8%
11TH GRADE
99.7/ 100
METRIC RATING
71st/ 347
METRIC RANK
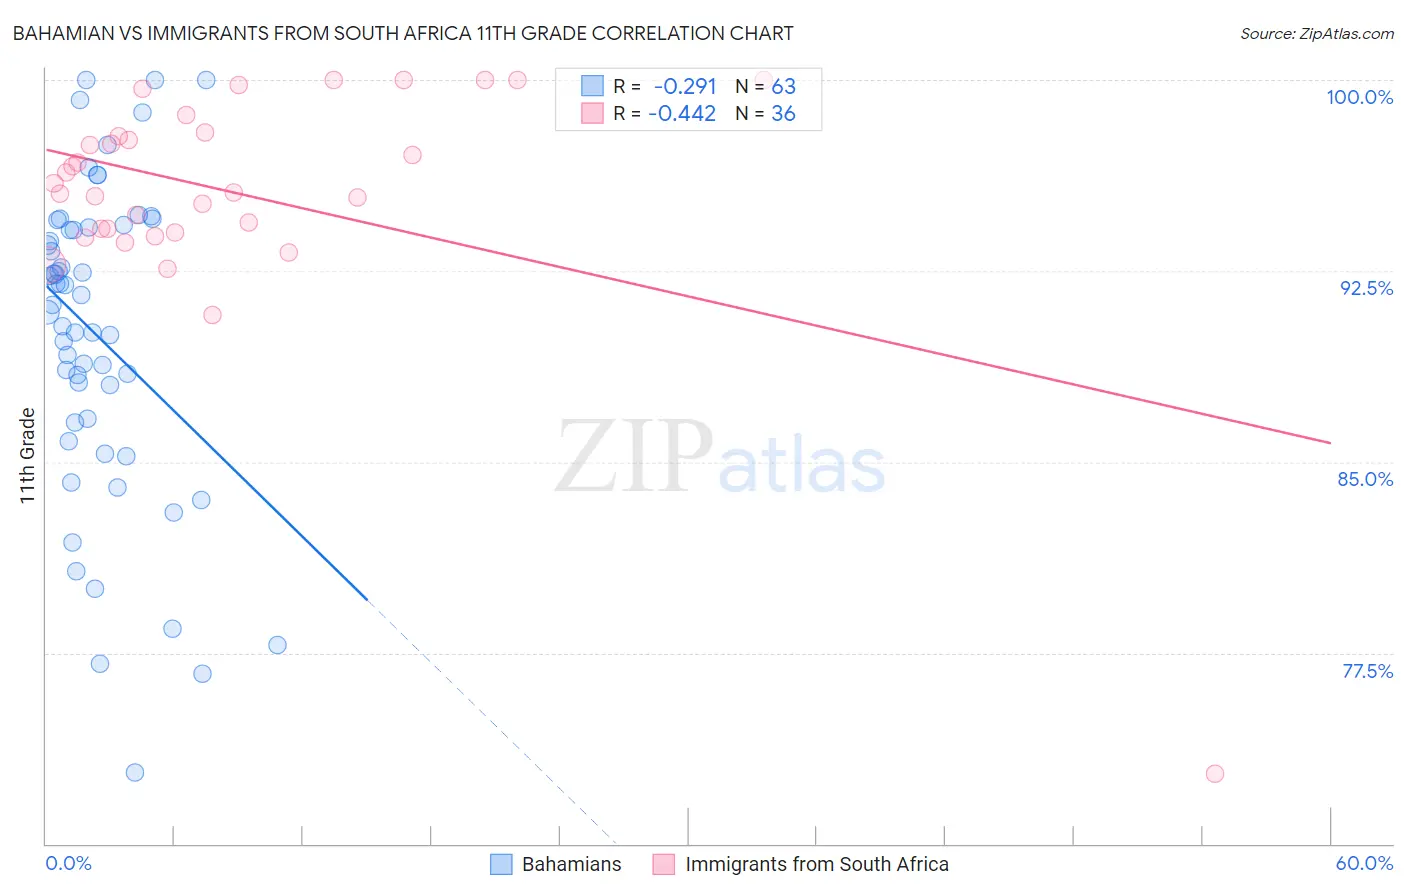
Bahamian vs Immigrants from South Africa 11th Grade Correlation Chart
The statistical analysis conducted on geographies consisting of 112,698,819 people shows a weak negative correlation between the proportion of Bahamians and percentage of population with at least 11th grade education in the United States with a correlation coefficient (R) of -0.291 and weighted average of 91.6%. Similarly, the statistical analysis conducted on geographies consisting of 233,321,693 people shows a moderate negative correlation between the proportion of Immigrants from South Africa and percentage of population with at least 11th grade education in the United States with a correlation coefficient (R) of -0.442 and weighted average of 93.8%, a difference of 2.4%.
11th Grade Correlation Summary
| Measurement | Bahamian | Immigrants from South Africa |
| Minimum | 72.8% | 72.7% |
| Maximum | 100.0% | 100.0% |
| Range | 27.2% | 27.3% |
| Mean | 90.0% | 95.6% |
| Median | 91.2% | 95.8% |
| Interquartile 25% (IQ1) | 86.5% | 94.1% |
| Interquartile 75% (IQ3) | 94.2% | 97.8% |
| Interquartile Range (IQR) | 7.7% | 3.8% |
| Standard Deviation (Sample) | 6.1% | 4.6% |
| Standard Deviation (Population) | 6.1% | 4.6% |
Similar Demographics by 11th Grade
Demographics Similar to Bahamians by 11th Grade
In terms of 11th grade, the demographic groups most similar to Bahamians are South American (91.6%, a difference of 0.020%), Immigrants from Middle Africa (91.6%, a difference of 0.030%), Immigrants from Thailand (91.6%, a difference of 0.060%), Senegalese (91.6%, a difference of 0.070%), and Hopi (91.7%, a difference of 0.080%).
| Demographics | Rating | Rank | 11th Grade |
| Armenians | 2.9 /100 | #234 | Tragic 91.7% |
| Sub-Saharan Africans | 2.9 /100 | #235 | Tragic 91.7% |
| Colombians | 2.8 /100 | #236 | Tragic 91.7% |
| Immigrants | Bolivia | 2.8 /100 | #237 | Tragic 91.7% |
| Comanche | 2.6 /100 | #238 | Tragic 91.7% |
| Hopi | 2.5 /100 | #239 | Tragic 91.7% |
| South Americans | 2.0 /100 | #240 | Tragic 91.6% |
| Bahamians | 1.8 /100 | #241 | Tragic 91.6% |
| Immigrants | Middle Africa | 1.6 /100 | #242 | Tragic 91.6% |
| Immigrants | Thailand | 1.4 /100 | #243 | Tragic 91.6% |
| Senegalese | 1.4 /100 | #244 | Tragic 91.6% |
| Africans | 1.3 /100 | #245 | Tragic 91.5% |
| Seminole | 1.2 /100 | #246 | Tragic 91.5% |
| Immigrants | Philippines | 1.0 /100 | #247 | Tragic 91.5% |
| Immigrants | Uzbekistan | 1.0 /100 | #248 | Tragic 91.5% |
Demographics Similar to Immigrants from South Africa by 11th Grade
In terms of 11th grade, the demographic groups most similar to Immigrants from South Africa are Immigrants from England (93.8%, a difference of 0.010%), Immigrants from Japan (93.8%, a difference of 0.030%), Romanian (93.8%, a difference of 0.050%), Immigrants from Czechoslovakia (93.8%, a difference of 0.050%), and Scotch-Irish (93.9%, a difference of 0.060%).
| Demographics | Rating | Rank | 11th Grade |
| Immigrants | Sweden | 99.8 /100 | #64 | Exceptional 93.9% |
| Native Hawaiians | 99.8 /100 | #65 | Exceptional 93.9% |
| Alaskan Athabascans | 99.8 /100 | #66 | Exceptional 93.9% |
| Immigrants | Netherlands | 99.8 /100 | #67 | Exceptional 93.9% |
| Zimbabweans | 99.8 /100 | #68 | Exceptional 93.9% |
| Scotch-Irish | 99.8 /100 | #69 | Exceptional 93.9% |
| Immigrants | England | 99.7 /100 | #70 | Exceptional 93.8% |
| Immigrants | South Africa | 99.7 /100 | #71 | Exceptional 93.8% |
| Immigrants | Japan | 99.7 /100 | #72 | Exceptional 93.8% |
| Romanians | 99.6 /100 | #73 | Exceptional 93.8% |
| Immigrants | Czechoslovakia | 99.6 /100 | #74 | Exceptional 93.8% |
| Immigrants | Latvia | 99.6 /100 | #75 | Exceptional 93.8% |
| Celtics | 99.5 /100 | #76 | Exceptional 93.7% |
| Aleuts | 99.5 /100 | #77 | Exceptional 93.7% |
| Soviet Union | 99.5 /100 | #78 | Exceptional 93.7% |