Bahamian vs Immigrants from Ghana Householder Income Under 25 years
COMPARE
Bahamian
Immigrants from Ghana
Householder Income Under 25 years
Householder Income Under 25 years Comparison
Bahamians
Immigrants from Ghana
$45,743
HOUSEHOLDER INCOME UNDER 25 YEARS
0.0/ 100
METRIC RATING
327th/ 347
METRIC RANK
$51,333
HOUSEHOLDER INCOME UNDER 25 YEARS
10.9/ 100
METRIC RATING
210th/ 347
METRIC RANK
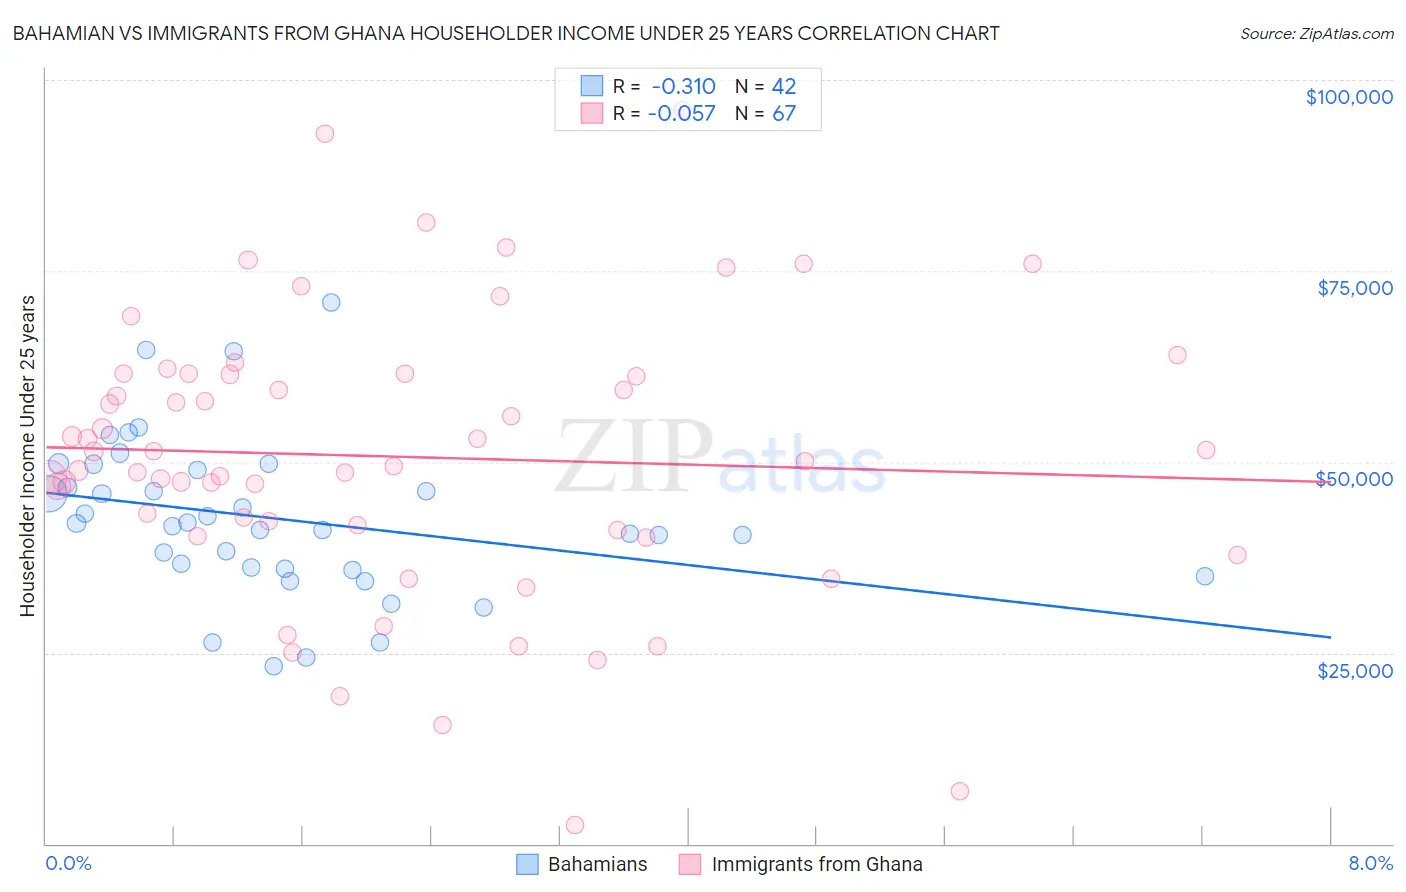
Bahamian vs Immigrants from Ghana Householder Income Under 25 years Correlation Chart
The statistical analysis conducted on geographies consisting of 104,021,755 people shows a mild negative correlation between the proportion of Bahamians and household income with householder under the age of 25 in the United States with a correlation coefficient (R) of -0.310 and weighted average of $45,743. Similarly, the statistical analysis conducted on geographies consisting of 179,741,503 people shows a slight negative correlation between the proportion of Immigrants from Ghana and household income with householder under the age of 25 in the United States with a correlation coefficient (R) of -0.057 and weighted average of $51,333, a difference of 12.2%.
Householder Income Under 25 years Correlation Summary
| Measurement | Bahamian | Immigrants from Ghana |
| Minimum | $23,250 | $2,499 |
| Maximum | $70,795 | $96,053 |
| Range | $47,545 | $93,554 |
| Mean | $42,583 | $50,684 |
| Median | $41,783 | $50,114 |
| Interquartile 25% (IQ1) | $36,008 | $41,042 |
| Interquartile 75% (IQ3) | $48,918 | $61,586 |
| Interquartile Range (IQR) | $12,910 | $20,544 |
| Standard Deviation (Sample) | $10,344 | $18,497 |
| Standard Deviation (Population) | $10,220 | $18,359 |
Similar Demographics by Householder Income Under 25 years
Demographics Similar to Bahamians by Householder Income Under 25 years
In terms of householder income under 25 years, the demographic groups most similar to Bahamians are Osage ($45,764, a difference of 0.050%), Immigrants from Bahamas ($45,793, a difference of 0.11%), German Russian ($45,673, a difference of 0.15%), Dutch West Indian ($45,816, a difference of 0.16%), and Seminole ($45,649, a difference of 0.21%).
| Demographics | Rating | Rank | Householder Income Under 25 years |
| Immigrants | Sudan | 0.0 /100 | #320 | Tragic $46,791 |
| Potawatomi | 0.0 /100 | #321 | Tragic $46,462 |
| Sioux | 0.0 /100 | #322 | Tragic $46,417 |
| Immigrants | Saudi Arabia | 0.0 /100 | #323 | Tragic $46,187 |
| Dutch West Indians | 0.0 /100 | #324 | Tragic $45,816 |
| Immigrants | Bahamas | 0.0 /100 | #325 | Tragic $45,793 |
| Osage | 0.0 /100 | #326 | Tragic $45,764 |
| Bahamians | 0.0 /100 | #327 | Tragic $45,743 |
| German Russians | 0.0 /100 | #328 | Tragic $45,673 |
| Seminole | 0.0 /100 | #329 | Tragic $45,649 |
| Indonesians | 0.0 /100 | #330 | Tragic $45,566 |
| Immigrants | Zaire | 0.0 /100 | #331 | Tragic $45,529 |
| Choctaw | 0.0 /100 | #332 | Tragic $45,450 |
| Creek | 0.0 /100 | #333 | Tragic $45,371 |
| Cajuns | 0.0 /100 | #334 | Tragic $45,338 |
Demographics Similar to Immigrants from Ghana by Householder Income Under 25 years
In terms of householder income under 25 years, the demographic groups most similar to Immigrants from Ghana are Irish ($51,317, a difference of 0.030%), Syrian ($51,353, a difference of 0.040%), Immigrants from Jordan ($51,370, a difference of 0.070%), Immigrants from Latin America ($51,387, a difference of 0.10%), and South African ($51,383, a difference of 0.10%).
| Demographics | Rating | Rank | Householder Income Under 25 years |
| Immigrants | Cameroon | 13.6 /100 | #203 | Poor $51,433 |
| Czechs | 13.2 /100 | #204 | Poor $51,421 |
| Cape Verdeans | 12.3 /100 | #205 | Poor $51,387 |
| Immigrants | Latin America | 12.3 /100 | #206 | Poor $51,387 |
| South Africans | 12.2 /100 | #207 | Poor $51,383 |
| Immigrants | Jordan | 11.9 /100 | #208 | Poor $51,370 |
| Syrians | 11.4 /100 | #209 | Poor $51,353 |
| Immigrants | Ghana | 10.9 /100 | #210 | Poor $51,333 |
| Irish | 10.6 /100 | #211 | Poor $51,317 |
| Immigrants | Panama | 9.7 /100 | #212 | Tragic $51,278 |
| Dutch | 9.4 /100 | #213 | Tragic $51,265 |
| Zimbabweans | 9.3 /100 | #214 | Tragic $51,259 |
| Icelanders | 9.1 /100 | #215 | Tragic $51,247 |
| French | 8.7 /100 | #216 | Tragic $51,230 |
| Czechoslovakians | 8.6 /100 | #217 | Tragic $51,224 |