Immigrants from Guatemala vs Immigrants from Afghanistan College, 1 year or more
COMPARE
Immigrants from Guatemala
Immigrants from Afghanistan
College, 1 year or more
College, 1 year or more Comparison
Immigrants from Guatemala
Immigrants from Afghanistan
50.7%
COLLEGE, 1 YEAR OR MORE
0.0/ 100
METRIC RATING
323rd/ 347
METRIC RANK
60.7%
COLLEGE, 1 YEAR OR MORE
83.1/ 100
METRIC RATING
141st/ 347
METRIC RANK
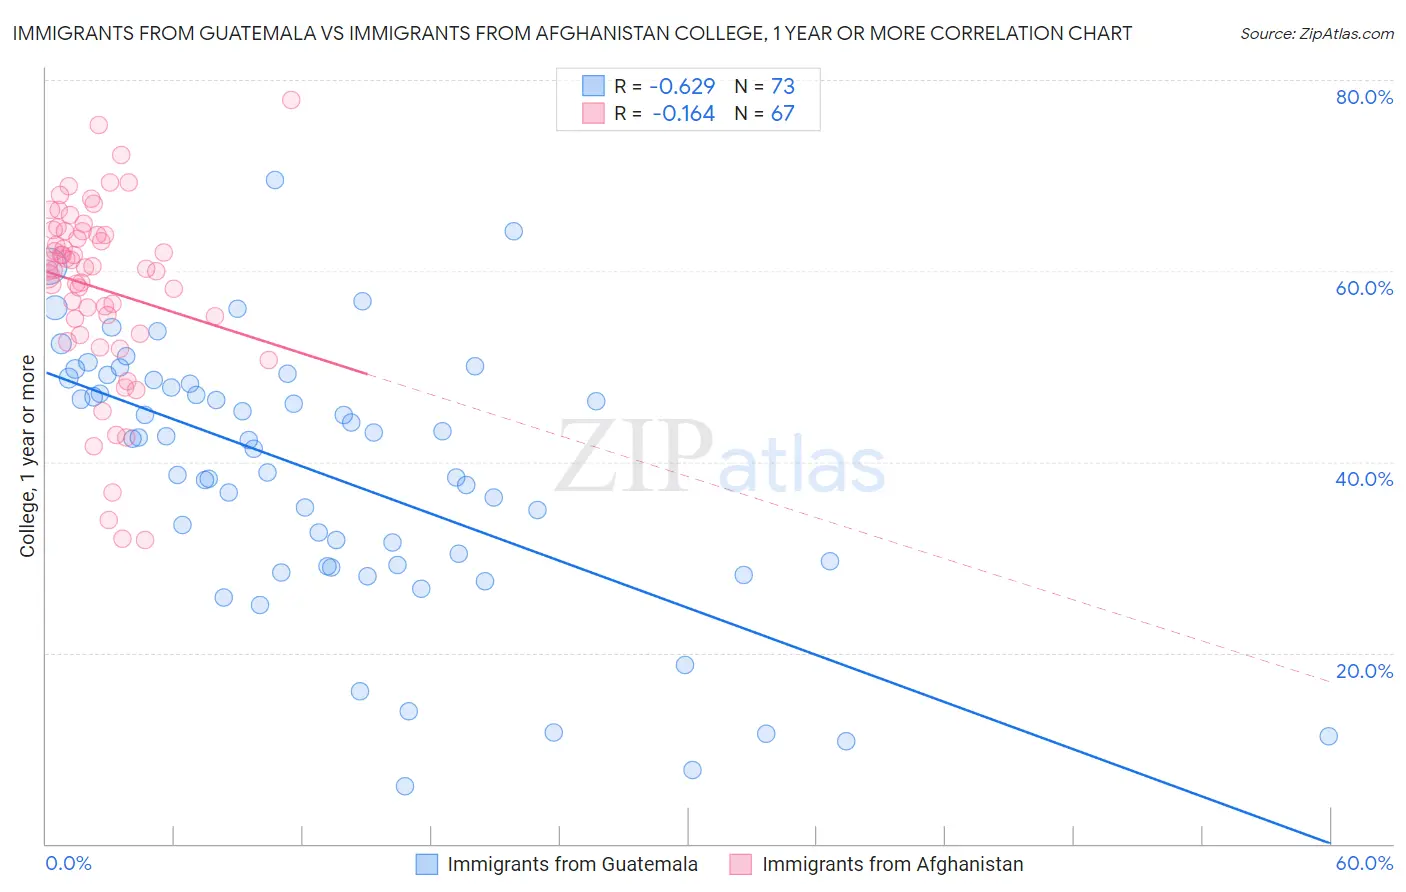
Immigrants from Guatemala vs Immigrants from Afghanistan College, 1 year or more Correlation Chart
The statistical analysis conducted on geographies consisting of 377,285,447 people shows a significant negative correlation between the proportion of Immigrants from Guatemala and percentage of population with at least college, 1 year or more education in the United States with a correlation coefficient (R) of -0.629 and weighted average of 50.7%. Similarly, the statistical analysis conducted on geographies consisting of 147,646,040 people shows a poor negative correlation between the proportion of Immigrants from Afghanistan and percentage of population with at least college, 1 year or more education in the United States with a correlation coefficient (R) of -0.164 and weighted average of 60.7%, a difference of 19.7%.
College, 1 year or more Correlation Summary
| Measurement | Immigrants from Guatemala | Immigrants from Afghanistan |
| Minimum | 6.0% | 31.8% |
| Maximum | 69.5% | 78.0% |
| Range | 63.5% | 46.2% |
| Mean | 38.6% | 58.2% |
| Median | 42.3% | 60.3% |
| Interquartile 25% (IQ1) | 29.2% | 53.4% |
| Interquartile 75% (IQ3) | 48.4% | 64.1% |
| Interquartile Range (IQR) | 19.2% | 10.7% |
| Standard Deviation (Sample) | 13.8% | 9.6% |
| Standard Deviation (Population) | 13.7% | 9.5% |
Similar Demographics by College, 1 year or more
Demographics Similar to Immigrants from Guatemala by College, 1 year or more
In terms of college, 1 year or more, the demographic groups most similar to Immigrants from Guatemala are Immigrants from Cuba (50.7%, a difference of 0.010%), Immigrants from Latin America (50.7%, a difference of 0.040%), Dominican (50.6%, a difference of 0.22%), Navajo (50.8%, a difference of 0.23%), and Menominee (50.6%, a difference of 0.26%).
| Demographics | Rating | Rank | College, 1 year or more |
| Cajuns | 0.0 /100 | #316 | Tragic 51.2% |
| Hispanics or Latinos | 0.0 /100 | #317 | Tragic 51.1% |
| Immigrants | Honduras | 0.0 /100 | #318 | Tragic 51.0% |
| Immigrants | El Salvador | 0.0 /100 | #319 | Tragic 51.0% |
| Kiowa | 0.0 /100 | #320 | Tragic 51.0% |
| Hopi | 0.0 /100 | #321 | Tragic 50.9% |
| Navajo | 0.0 /100 | #322 | Tragic 50.8% |
| Immigrants | Guatemala | 0.0 /100 | #323 | Tragic 50.7% |
| Immigrants | Cuba | 0.0 /100 | #324 | Tragic 50.7% |
| Immigrants | Latin America | 0.0 /100 | #325 | Tragic 50.7% |
| Dominicans | 0.0 /100 | #326 | Tragic 50.6% |
| Menominee | 0.0 /100 | #327 | Tragic 50.6% |
| Dutch West Indians | 0.0 /100 | #328 | Tragic 50.5% |
| Cape Verdeans | 0.0 /100 | #329 | Tragic 50.3% |
| Natives/Alaskans | 0.0 /100 | #330 | Tragic 50.2% |
Demographics Similar to Immigrants from Afghanistan by College, 1 year or more
In terms of college, 1 year or more, the demographic groups most similar to Immigrants from Afghanistan are Iraqi (60.7%, a difference of 0.020%), Polish (60.7%, a difference of 0.030%), Canadian (60.6%, a difference of 0.040%), Taiwanese (60.7%, a difference of 0.11%), and Immigrants from Eritrea (60.7%, a difference of 0.11%).
| Demographics | Rating | Rank | College, 1 year or more |
| Immigrants | Venezuela | 87.9 /100 | #134 | Excellent 61.0% |
| Immigrants | Uganda | 87.4 /100 | #135 | Excellent 60.9% |
| Basques | 87.2 /100 | #136 | Excellent 60.9% |
| Slovenes | 86.5 /100 | #137 | Excellent 60.9% |
| Taiwanese | 84.3 /100 | #138 | Excellent 60.7% |
| Immigrants | Eritrea | 84.3 /100 | #139 | Excellent 60.7% |
| Iraqis | 83.3 /100 | #140 | Excellent 60.7% |
| Immigrants | Afghanistan | 83.1 /100 | #141 | Excellent 60.7% |
| Poles | 82.8 /100 | #142 | Excellent 60.7% |
| Canadians | 82.7 /100 | #143 | Excellent 60.6% |
| Czechs | 81.9 /100 | #144 | Excellent 60.6% |
| Slavs | 81.1 /100 | #145 | Excellent 60.6% |
| Scottish | 80.2 /100 | #146 | Excellent 60.5% |
| Immigrants | Kenya | 79.1 /100 | #147 | Good 60.5% |
| Kenyans | 79.0 /100 | #148 | Good 60.5% |