Okinawan vs Immigrants from Afghanistan College, 1 year or more
COMPARE
Okinawan
Immigrants from Afghanistan
College, 1 year or more
College, 1 year or more Comparison
Okinawans
Immigrants from Afghanistan
69.0%
COLLEGE, 1 YEAR OR MORE
100.0/ 100
METRIC RATING
7th/ 347
METRIC RANK
60.7%
COLLEGE, 1 YEAR OR MORE
83.1/ 100
METRIC RATING
141st/ 347
METRIC RANK
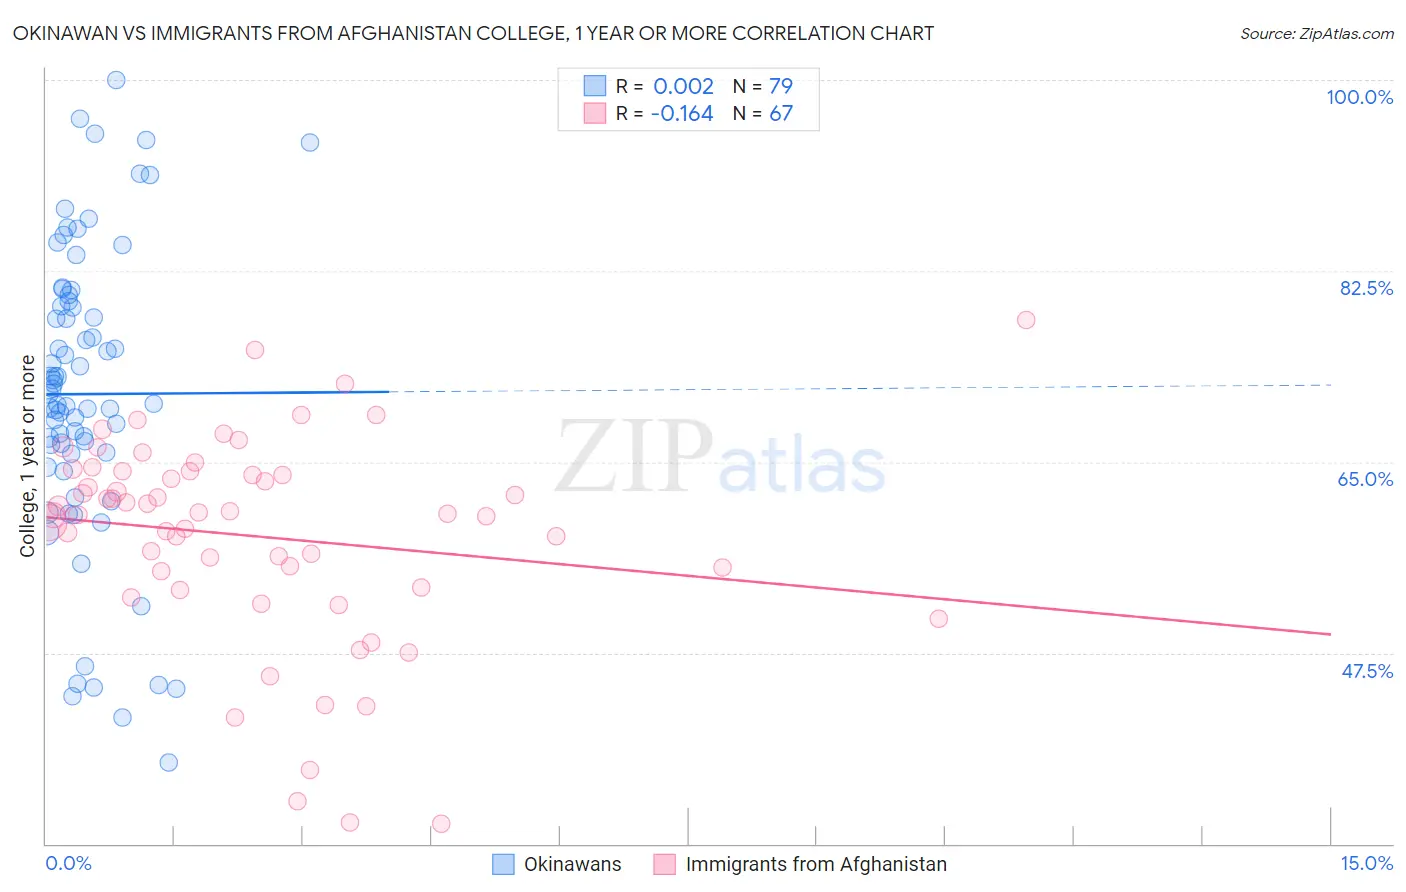
Okinawan vs Immigrants from Afghanistan College, 1 year or more Correlation Chart
The statistical analysis conducted on geographies consisting of 73,779,368 people shows no correlation between the proportion of Okinawans and percentage of population with at least college, 1 year or more education in the United States with a correlation coefficient (R) of 0.002 and weighted average of 69.0%. Similarly, the statistical analysis conducted on geographies consisting of 147,646,040 people shows a poor negative correlation between the proportion of Immigrants from Afghanistan and percentage of population with at least college, 1 year or more education in the United States with a correlation coefficient (R) of -0.164 and weighted average of 60.7%, a difference of 13.7%.
College, 1 year or more Correlation Summary
| Measurement | Okinawan | Immigrants from Afghanistan |
| Minimum | 37.5% | 31.8% |
| Maximum | 100.0% | 78.0% |
| Range | 62.5% | 46.2% |
| Mean | 71.2% | 58.2% |
| Median | 71.2% | 60.3% |
| Interquartile 25% (IQ1) | 65.7% | 53.4% |
| Interquartile 75% (IQ3) | 79.7% | 64.1% |
| Interquartile Range (IQR) | 14.0% | 10.7% |
| Standard Deviation (Sample) | 13.7% | 9.6% |
| Standard Deviation (Population) | 13.6% | 9.5% |
Similar Demographics by College, 1 year or more
Demographics Similar to Okinawans by College, 1 year or more
In terms of college, 1 year or more, the demographic groups most similar to Okinawans are Thai (68.6%, a difference of 0.54%), Immigrants from Iran (69.5%, a difference of 0.77%), Immigrants from Taiwan (69.6%, a difference of 0.97%), Immigrants from India (69.6%, a difference of 0.97%), and Iranian (70.0%, a difference of 1.5%).
| Demographics | Rating | Rank | College, 1 year or more |
| Filipinos | 100.0 /100 | #1 | Exceptional 71.0% |
| Immigrants | Singapore | 100.0 /100 | #2 | Exceptional 70.1% |
| Iranians | 100.0 /100 | #3 | Exceptional 70.0% |
| Immigrants | Taiwan | 100.0 /100 | #4 | Exceptional 69.6% |
| Immigrants | India | 100.0 /100 | #5 | Exceptional 69.6% |
| Immigrants | Iran | 100.0 /100 | #6 | Exceptional 69.5% |
| Okinawans | 100.0 /100 | #7 | Exceptional 69.0% |
| Thais | 100.0 /100 | #8 | Exceptional 68.6% |
| Immigrants | Israel | 100.0 /100 | #9 | Exceptional 67.8% |
| Immigrants | Australia | 100.0 /100 | #10 | Exceptional 67.7% |
| Immigrants | South Central Asia | 100.0 /100 | #11 | Exceptional 67.1% |
| Cypriots | 100.0 /100 | #12 | Exceptional 67.0% |
| Immigrants | Sweden | 100.0 /100 | #13 | Exceptional 66.8% |
| Burmese | 100.0 /100 | #14 | Exceptional 66.7% |
| Cambodians | 100.0 /100 | #15 | Exceptional 66.7% |
Demographics Similar to Immigrants from Afghanistan by College, 1 year or more
In terms of college, 1 year or more, the demographic groups most similar to Immigrants from Afghanistan are Iraqi (60.7%, a difference of 0.020%), Polish (60.7%, a difference of 0.030%), Canadian (60.6%, a difference of 0.040%), Taiwanese (60.7%, a difference of 0.11%), and Immigrants from Eritrea (60.7%, a difference of 0.11%).
| Demographics | Rating | Rank | College, 1 year or more |
| Immigrants | Venezuela | 87.9 /100 | #134 | Excellent 61.0% |
| Immigrants | Uganda | 87.4 /100 | #135 | Excellent 60.9% |
| Basques | 87.2 /100 | #136 | Excellent 60.9% |
| Slovenes | 86.5 /100 | #137 | Excellent 60.9% |
| Taiwanese | 84.3 /100 | #138 | Excellent 60.7% |
| Immigrants | Eritrea | 84.3 /100 | #139 | Excellent 60.7% |
| Iraqis | 83.3 /100 | #140 | Excellent 60.7% |
| Immigrants | Afghanistan | 83.1 /100 | #141 | Excellent 60.7% |
| Poles | 82.8 /100 | #142 | Excellent 60.7% |
| Canadians | 82.7 /100 | #143 | Excellent 60.6% |
| Czechs | 81.9 /100 | #144 | Excellent 60.6% |
| Slavs | 81.1 /100 | #145 | Excellent 60.6% |
| Scottish | 80.2 /100 | #146 | Excellent 60.5% |
| Immigrants | Kenya | 79.1 /100 | #147 | Good 60.5% |
| Kenyans | 79.0 /100 | #148 | Good 60.5% |