Sudanese vs West Indian Bachelor's Degree
COMPARE
Sudanese
West Indian
Bachelor's Degree
Bachelor's Degree Comparison
Sudanese
West Indians
38.9%
BACHELOR'S DEGREE
76.4/ 100
METRIC RATING
152nd/ 347
METRIC RANK
35.8%
BACHELOR'S DEGREE
9.7/ 100
METRIC RATING
219th/ 347
METRIC RANK
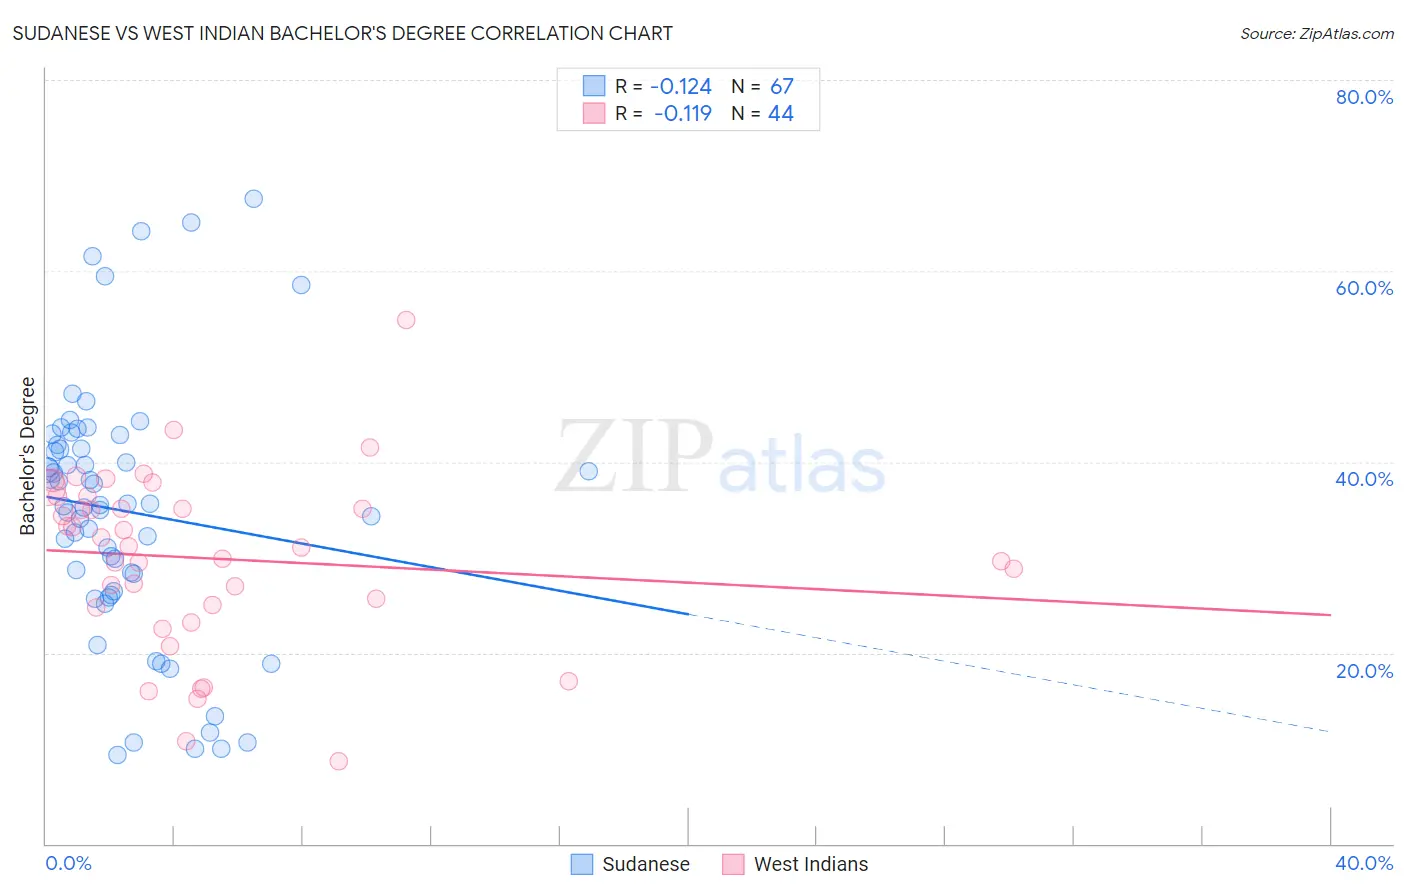
Sudanese vs West Indian Bachelor's Degree Correlation Chart
The statistical analysis conducted on geographies consisting of 110,140,841 people shows a poor negative correlation between the proportion of Sudanese and percentage of population with at least bachelor's degree education in the United States with a correlation coefficient (R) of -0.124 and weighted average of 38.9%. Similarly, the statistical analysis conducted on geographies consisting of 254,052,702 people shows a poor negative correlation between the proportion of West Indians and percentage of population with at least bachelor's degree education in the United States with a correlation coefficient (R) of -0.119 and weighted average of 35.8%, a difference of 8.7%.
Bachelor's Degree Correlation Summary
| Measurement | Sudanese | West Indian |
| Minimum | 9.3% | 8.6% |
| Maximum | 67.6% | 54.9% |
| Range | 58.3% | 46.3% |
| Mean | 34.8% | 29.9% |
| Median | 35.5% | 31.1% |
| Interquartile 25% (IQ1) | 26.5% | 24.9% |
| Interquartile 75% (IQ3) | 41.8% | 35.7% |
| Interquartile Range (IQR) | 15.3% | 10.9% |
| Standard Deviation (Sample) | 13.4% | 9.2% |
| Standard Deviation (Population) | 13.3% | 9.1% |
Similar Demographics by Bachelor's Degree
Demographics Similar to Sudanese by Bachelor's Degree
In terms of bachelor's degree, the demographic groups most similar to Sudanese are Immigrants from Africa (38.9%, a difference of 0.020%), Slavic (38.9%, a difference of 0.060%), South American (38.9%, a difference of 0.12%), Immigrants from Poland (39.0%, a difference of 0.15%), and Canadian (38.8%, a difference of 0.18%).
| Demographics | Rating | Rank | Bachelor's Degree |
| Slovenes | 79.5 /100 | #145 | Good 39.1% |
| Swedes | 79.2 /100 | #146 | Good 39.1% |
| Immigrants | Sierra Leone | 79.0 /100 | #147 | Good 39.0% |
| Iraqis | 78.1 /100 | #148 | Good 39.0% |
| Immigrants | Poland | 77.5 /100 | #149 | Good 39.0% |
| South Americans | 77.3 /100 | #150 | Good 38.9% |
| Immigrants | Africa | 76.5 /100 | #151 | Good 38.9% |
| Sudanese | 76.4 /100 | #152 | Good 38.9% |
| Slavs | 75.9 /100 | #153 | Good 38.9% |
| Canadians | 75.0 /100 | #154 | Good 38.8% |
| Immigrants | Kenya | 73.8 /100 | #155 | Good 38.8% |
| Kenyans | 72.5 /100 | #156 | Good 38.7% |
| Immigrants | South America | 70.1 /100 | #157 | Good 38.6% |
| Immigrants | Germany | 69.6 /100 | #158 | Good 38.6% |
| Chinese | 66.6 /100 | #159 | Good 38.5% |
Demographics Similar to West Indians by Bachelor's Degree
In terms of bachelor's degree, the demographic groups most similar to West Indians are Subsaharan African (35.8%, a difference of 0.030%), Spanish (35.8%, a difference of 0.040%), German Russian (35.8%, a difference of 0.13%), Dutch (35.7%, a difference of 0.15%), and Trinidadian and Tobagonian (35.7%, a difference of 0.29%).
| Demographics | Rating | Rank | Bachelor's Degree |
| Immigrants | Philippines | 17.8 /100 | #212 | Poor 36.4% |
| Immigrants | Panama | 14.2 /100 | #213 | Poor 36.2% |
| Germans | 13.9 /100 | #214 | Poor 36.1% |
| Immigrants | Western Africa | 13.8 /100 | #215 | Poor 36.1% |
| Barbadians | 13.5 /100 | #216 | Poor 36.1% |
| German Russians | 10.2 /100 | #217 | Poor 35.8% |
| Sub-Saharan Africans | 9.8 /100 | #218 | Tragic 35.8% |
| West Indians | 9.7 /100 | #219 | Tragic 35.8% |
| Spanish | 9.6 /100 | #220 | Tragic 35.8% |
| Dutch | 9.2 /100 | #221 | Tragic 35.7% |
| Trinidadians and Tobagonians | 8.8 /100 | #222 | Tragic 35.7% |
| French Canadians | 8.3 /100 | #223 | Tragic 35.6% |
| Immigrants | Barbados | 7.5 /100 | #224 | Tragic 35.5% |
| Immigrants | Burma/Myanmar | 7.3 /100 | #225 | Tragic 35.5% |
| Portuguese | 7.2 /100 | #226 | Tragic 35.5% |