Austrian vs West Indian 11th Grade
COMPARE
Austrian
West Indian
11th Grade
11th Grade Comparison
Austrians
West Indians
94.0%
11TH GRADE
99.8/ 100
METRIC RATING
62nd/ 347
METRIC RANK
91.0%
11TH GRADE
0.1/ 100
METRIC RATING
272nd/ 347
METRIC RANK
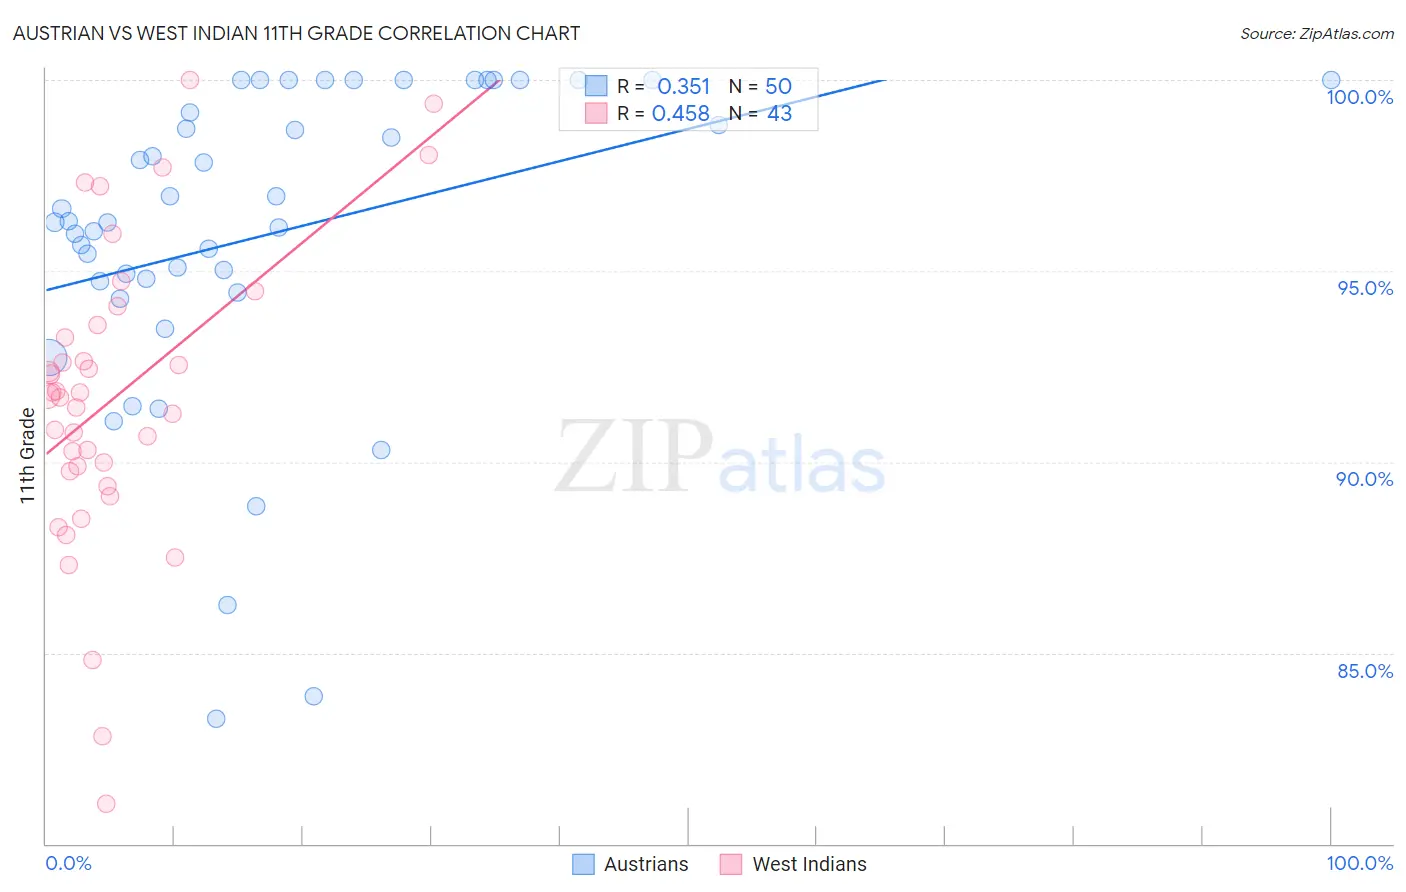
Austrian vs West Indian 11th Grade Correlation Chart
The statistical analysis conducted on geographies consisting of 452,082,820 people shows a mild positive correlation between the proportion of Austrians and percentage of population with at least 11th grade education in the United States with a correlation coefficient (R) of 0.351 and weighted average of 94.0%. Similarly, the statistical analysis conducted on geographies consisting of 254,059,006 people shows a moderate positive correlation between the proportion of West Indians and percentage of population with at least 11th grade education in the United States with a correlation coefficient (R) of 0.458 and weighted average of 91.0%, a difference of 3.3%.
11th Grade Correlation Summary
| Measurement | Austrian | West Indian |
| Minimum | 83.3% | 81.1% |
| Maximum | 100.0% | 100.0% |
| Range | 16.7% | 18.9% |
| Mean | 96.0% | 91.7% |
| Median | 96.3% | 91.7% |
| Interquartile 25% (IQ1) | 94.7% | 89.7% |
| Interquartile 75% (IQ3) | 100.0% | 93.6% |
| Interquartile Range (IQR) | 5.3% | 3.8% |
| Standard Deviation (Sample) | 4.1% | 4.0% |
| Standard Deviation (Population) | 4.1% | 3.9% |
Similar Demographics by 11th Grade
Demographics Similar to Austrians by 11th Grade
In terms of 11th grade, the demographic groups most similar to Austrians are Immigrants from Belgium (94.0%, a difference of 0.0%), French Canadian (94.0%, a difference of 0.010%), New Zealander (94.0%, a difference of 0.010%), Iranian (94.0%, a difference of 0.010%), and Bhutanese (94.0%, a difference of 0.010%).
| Demographics | Rating | Rank | 11th Grade |
| Czechoslovakians | 99.9 /100 | #55 | Exceptional 94.0% |
| French Canadians | 99.9 /100 | #56 | Exceptional 94.0% |
| New Zealanders | 99.9 /100 | #57 | Exceptional 94.0% |
| Iranians | 99.9 /100 | #58 | Exceptional 94.0% |
| Bhutanese | 99.8 /100 | #59 | Exceptional 94.0% |
| Okinawans | 99.8 /100 | #60 | Exceptional 94.0% |
| Immigrants | Belgium | 99.8 /100 | #61 | Exceptional 94.0% |
| Austrians | 99.8 /100 | #62 | Exceptional 94.0% |
| Ukrainians | 99.8 /100 | #63 | Exceptional 94.0% |
| Immigrants | Sweden | 99.8 /100 | #64 | Exceptional 93.9% |
| Native Hawaiians | 99.8 /100 | #65 | Exceptional 93.9% |
| Alaskan Athabascans | 99.8 /100 | #66 | Exceptional 93.9% |
| Immigrants | Netherlands | 99.8 /100 | #67 | Exceptional 93.9% |
| Zimbabweans | 99.8 /100 | #68 | Exceptional 93.9% |
| Scotch-Irish | 99.8 /100 | #69 | Exceptional 93.9% |
Demographics Similar to West Indians by 11th Grade
In terms of 11th grade, the demographic groups most similar to West Indians are Immigrants from Peru (91.0%, a difference of 0.0%), Trinidadian and Tobagonian (91.1%, a difference of 0.040%), Paiute (91.0%, a difference of 0.050%), Ute (91.1%, a difference of 0.060%), and U.S. Virgin Islander (91.1%, a difference of 0.090%).
| Demographics | Rating | Rank | 11th Grade |
| Pueblo | 0.3 /100 | #265 | Tragic 91.2% |
| Immigrants | Western Africa | 0.3 /100 | #266 | Tragic 91.2% |
| Immigrants | Jamaica | 0.3 /100 | #267 | Tragic 91.2% |
| U.S. Virgin Islanders | 0.2 /100 | #268 | Tragic 91.1% |
| Ute | 0.2 /100 | #269 | Tragic 91.1% |
| Trinidadians and Tobagonians | 0.2 /100 | #270 | Tragic 91.1% |
| Immigrants | Peru | 0.1 /100 | #271 | Tragic 91.0% |
| West Indians | 0.1 /100 | #272 | Tragic 91.0% |
| Paiute | 0.1 /100 | #273 | Tragic 91.0% |
| Immigrants | Trinidad and Tobago | 0.1 /100 | #274 | Tragic 90.9% |
| Immigrants | South Eastern Asia | 0.1 /100 | #275 | Tragic 90.9% |
| Bangladeshis | 0.1 /100 | #276 | Tragic 90.9% |
| Immigrants | Congo | 0.1 /100 | #277 | Tragic 90.9% |
| Malaysians | 0.1 /100 | #278 | Tragic 90.8% |
| Barbadians | 0.0 /100 | #279 | Tragic 90.8% |