Immigrants from Cameroon vs West Indian Bachelor's Degree
COMPARE
Immigrants from Cameroon
West Indian
Bachelor's Degree
Bachelor's Degree Comparison
Immigrants from Cameroon
West Indians
37.7%
BACHELOR'S DEGREE
46.8/ 100
METRIC RATING
178th/ 347
METRIC RANK
35.8%
BACHELOR'S DEGREE
9.7/ 100
METRIC RATING
219th/ 347
METRIC RANK
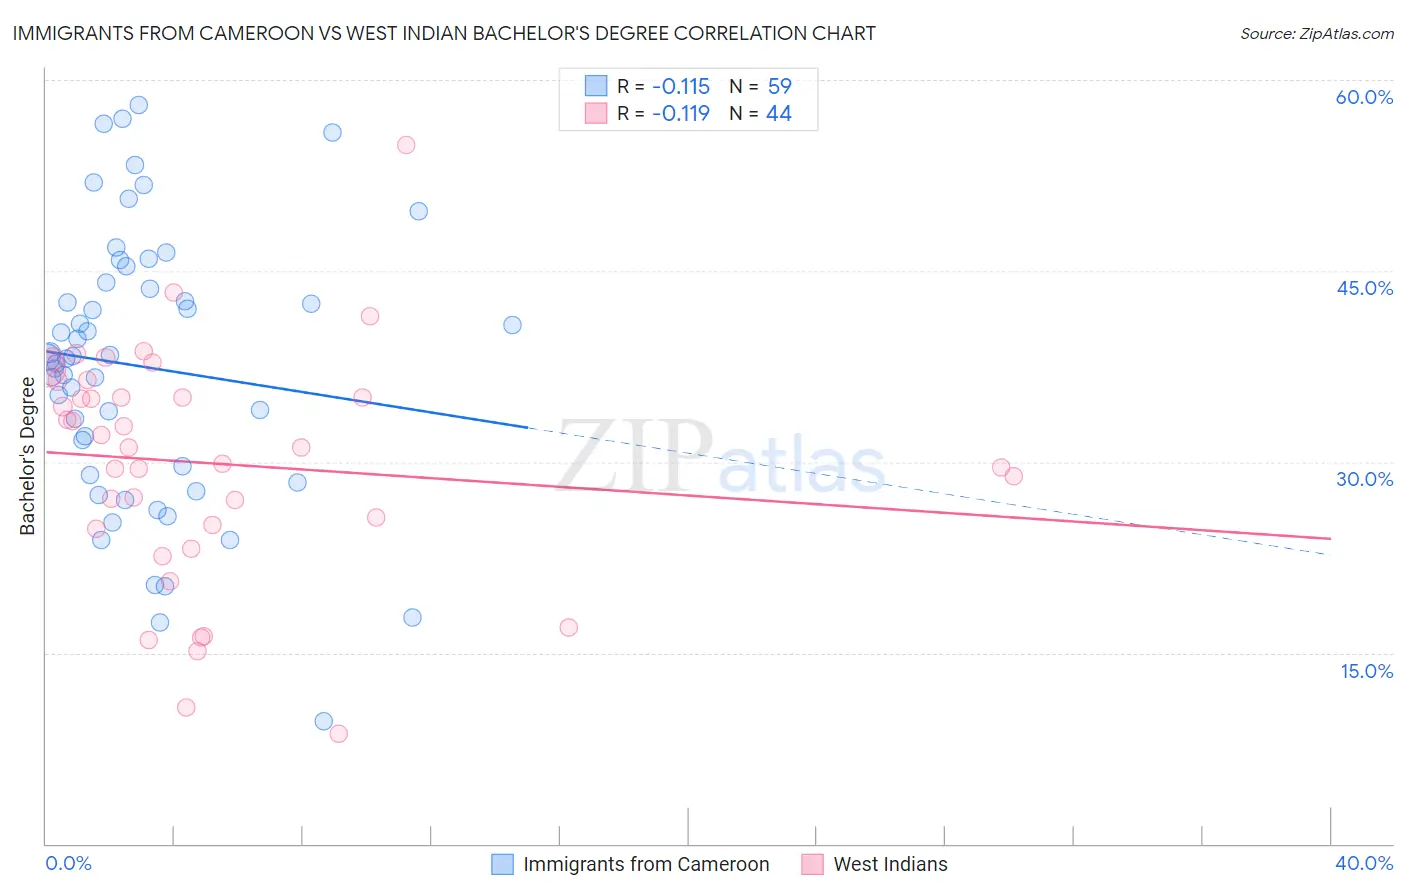
Immigrants from Cameroon vs West Indian Bachelor's Degree Correlation Chart
The statistical analysis conducted on geographies consisting of 130,767,721 people shows a poor negative correlation between the proportion of Immigrants from Cameroon and percentage of population with at least bachelor's degree education in the United States with a correlation coefficient (R) of -0.115 and weighted average of 37.7%. Similarly, the statistical analysis conducted on geographies consisting of 254,052,702 people shows a poor negative correlation between the proportion of West Indians and percentage of population with at least bachelor's degree education in the United States with a correlation coefficient (R) of -0.119 and weighted average of 35.8%, a difference of 5.4%.
Bachelor's Degree Correlation Summary
| Measurement | Immigrants from Cameroon | West Indian |
| Minimum | 9.6% | 8.6% |
| Maximum | 58.0% | 54.9% |
| Range | 48.4% | 46.3% |
| Mean | 37.4% | 29.9% |
| Median | 38.2% | 31.1% |
| Interquartile 25% (IQ1) | 28.9% | 24.9% |
| Interquartile 75% (IQ3) | 44.1% | 35.7% |
| Interquartile Range (IQR) | 15.1% | 10.9% |
| Standard Deviation (Sample) | 10.7% | 9.2% |
| Standard Deviation (Population) | 10.6% | 9.1% |
Similar Demographics by Bachelor's Degree
Demographics Similar to Immigrants from Cameroon by Bachelor's Degree
In terms of bachelor's degree, the demographic groups most similar to Immigrants from Cameroon are Basque (37.7%, a difference of 0.060%), Costa Rican (37.7%, a difference of 0.080%), Immigrants from Colombia (37.7%, a difference of 0.13%), Immigrants from Uruguay (37.8%, a difference of 0.15%), and Irish (37.6%, a difference of 0.24%).
| Demographics | Rating | Rank | Bachelor's Degree |
| Bermudans | 54.2 /100 | #171 | Average 38.0% |
| Immigrants | Somalia | 52.8 /100 | #172 | Average 37.9% |
| Immigrants | Iraq | 52.5 /100 | #173 | Average 37.9% |
| Immigrants | Bangladesh | 50.0 /100 | #174 | Average 37.8% |
| Immigrants | Uruguay | 48.3 /100 | #175 | Average 37.8% |
| Costa Ricans | 47.6 /100 | #176 | Average 37.7% |
| Basques | 47.4 /100 | #177 | Average 37.7% |
| Immigrants | Cameroon | 46.8 /100 | #178 | Average 37.7% |
| Immigrants | Colombia | 45.4 /100 | #179 | Average 37.7% |
| Irish | 44.3 /100 | #180 | Average 37.6% |
| Immigrants | Senegal | 43.8 /100 | #181 | Average 37.6% |
| Immigrants | Bosnia and Herzegovina | 43.4 /100 | #182 | Average 37.6% |
| Senegalese | 42.2 /100 | #183 | Average 37.5% |
| Scandinavians | 41.7 /100 | #184 | Average 37.5% |
| Immigrants | Peru | 41.3 /100 | #185 | Average 37.5% |
Demographics Similar to West Indians by Bachelor's Degree
In terms of bachelor's degree, the demographic groups most similar to West Indians are Subsaharan African (35.8%, a difference of 0.030%), Spanish (35.8%, a difference of 0.040%), German Russian (35.8%, a difference of 0.13%), Dutch (35.7%, a difference of 0.15%), and Trinidadian and Tobagonian (35.7%, a difference of 0.29%).
| Demographics | Rating | Rank | Bachelor's Degree |
| Immigrants | Philippines | 17.8 /100 | #212 | Poor 36.4% |
| Immigrants | Panama | 14.2 /100 | #213 | Poor 36.2% |
| Germans | 13.9 /100 | #214 | Poor 36.1% |
| Immigrants | Western Africa | 13.8 /100 | #215 | Poor 36.1% |
| Barbadians | 13.5 /100 | #216 | Poor 36.1% |
| German Russians | 10.2 /100 | #217 | Poor 35.8% |
| Sub-Saharan Africans | 9.8 /100 | #218 | Tragic 35.8% |
| West Indians | 9.7 /100 | #219 | Tragic 35.8% |
| Spanish | 9.6 /100 | #220 | Tragic 35.8% |
| Dutch | 9.2 /100 | #221 | Tragic 35.7% |
| Trinidadians and Tobagonians | 8.8 /100 | #222 | Tragic 35.7% |
| French Canadians | 8.3 /100 | #223 | Tragic 35.6% |
| Immigrants | Barbados | 7.5 /100 | #224 | Tragic 35.5% |
| Immigrants | Burma/Myanmar | 7.3 /100 | #225 | Tragic 35.5% |
| Portuguese | 7.2 /100 | #226 | Tragic 35.5% |