Armenian vs Immigrants from Israel Bachelor's Degree
COMPARE
Armenian
Immigrants from Israel
Bachelor's Degree
Bachelor's Degree Comparison
Armenians
Immigrants from Israel
42.3%
BACHELOR'S DEGREE
99.2/ 100
METRIC RATING
83rd/ 347
METRIC RANK
50.0%
BACHELOR'S DEGREE
100.0/ 100
METRIC RATING
9th/ 347
METRIC RANK
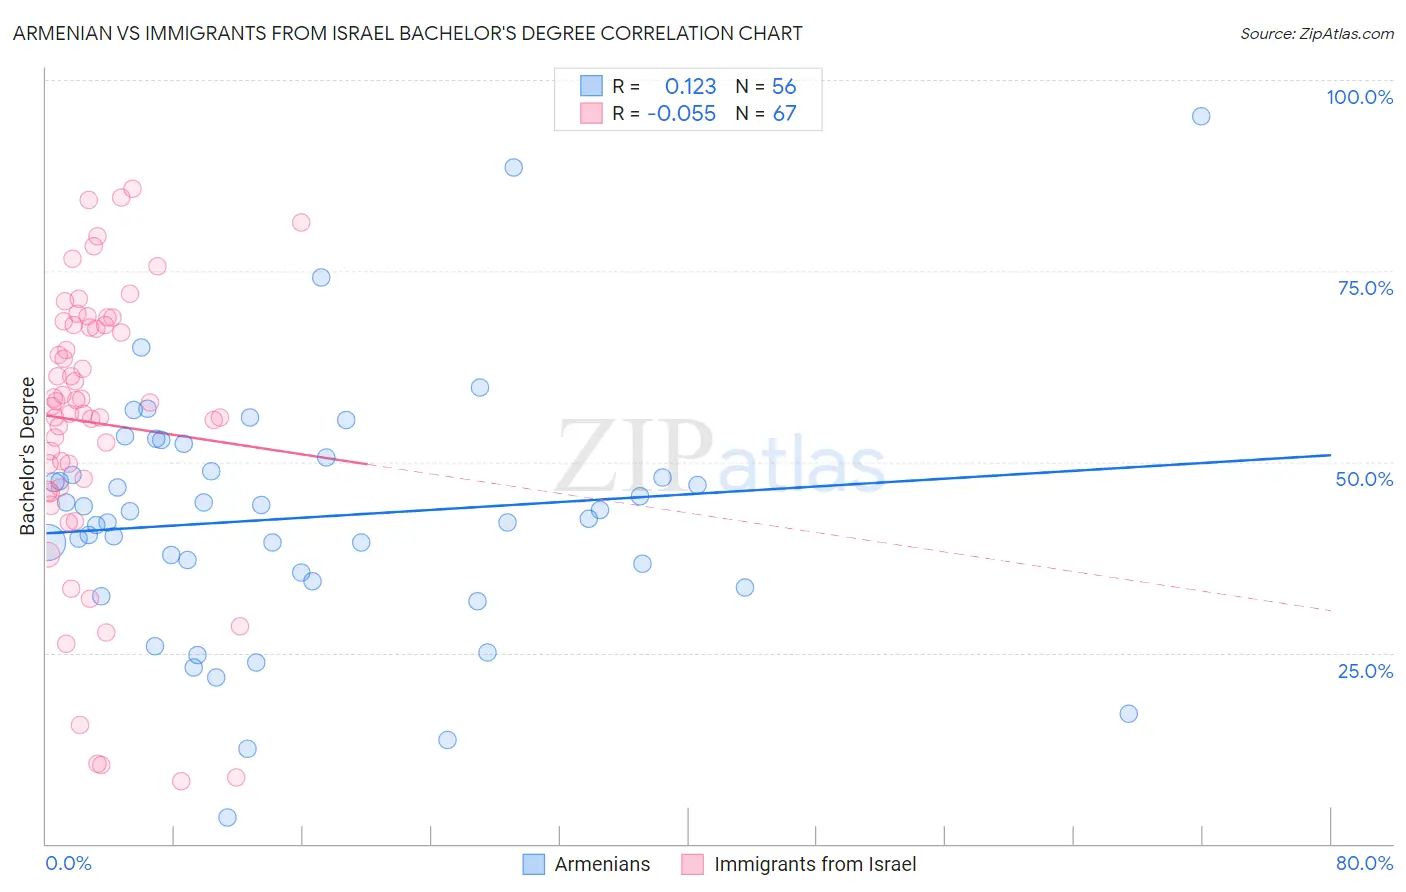
Armenian vs Immigrants from Israel Bachelor's Degree Correlation Chart
The statistical analysis conducted on geographies consisting of 310,935,621 people shows a poor positive correlation between the proportion of Armenians and percentage of population with at least bachelor's degree education in the United States with a correlation coefficient (R) of 0.123 and weighted average of 42.3%. Similarly, the statistical analysis conducted on geographies consisting of 210,024,310 people shows a slight negative correlation between the proportion of Immigrants from Israel and percentage of population with at least bachelor's degree education in the United States with a correlation coefficient (R) of -0.055 and weighted average of 50.0%, a difference of 18.3%.
Bachelor's Degree Correlation Summary
| Measurement | Armenian | Immigrants from Israel |
| Minimum | 3.4% | 8.2% |
| Maximum | 95.3% | 85.8% |
| Range | 91.9% | 77.5% |
| Mean | 42.7% | 55.1% |
| Median | 43.0% | 57.8% |
| Interquartile 25% (IQ1) | 35.0% | 46.6% |
| Interquartile 75% (IQ3) | 49.7% | 67.9% |
| Interquartile Range (IQR) | 14.8% | 21.3% |
| Standard Deviation (Sample) | 16.3% | 18.6% |
| Standard Deviation (Population) | 16.2% | 18.4% |
Similar Demographics by Bachelor's Degree
Demographics Similar to Armenians by Bachelor's Degree
In terms of bachelor's degree, the demographic groups most similar to Armenians are Immigrants from Western Asia (42.3%, a difference of 0.020%), Immigrants from Scotland (42.3%, a difference of 0.030%), Lithuanian (42.2%, a difference of 0.040%), Immigrants from Hungary (42.3%, a difference of 0.10%), and Immigrants from Croatia (42.3%, a difference of 0.11%).
| Demographics | Rating | Rank | Bachelor's Degree |
| Immigrants | Egypt | 99.4 /100 | #76 | Exceptional 42.6% |
| Immigrants | Eastern Europe | 99.4 /100 | #77 | Exceptional 42.5% |
| Immigrants | Ethiopia | 99.4 /100 | #78 | Exceptional 42.5% |
| Immigrants | Lebanon | 99.3 /100 | #79 | Exceptional 42.4% |
| Immigrants | Croatia | 99.2 /100 | #80 | Exceptional 42.3% |
| Immigrants | Hungary | 99.2 /100 | #81 | Exceptional 42.3% |
| Immigrants | Scotland | 99.2 /100 | #82 | Exceptional 42.3% |
| Armenians | 99.2 /100 | #83 | Exceptional 42.3% |
| Immigrants | Western Asia | 99.2 /100 | #84 | Exceptional 42.3% |
| Lithuanians | 99.2 /100 | #85 | Exceptional 42.2% |
| Immigrants | Brazil | 99.2 /100 | #86 | Exceptional 42.2% |
| Carpatho Rusyns | 99.0 /100 | #87 | Exceptional 42.1% |
| Immigrants | Western Europe | 99.0 /100 | #88 | Exceptional 42.0% |
| Greeks | 99.0 /100 | #89 | Exceptional 42.0% |
| Laotians | 98.9 /100 | #90 | Exceptional 42.0% |
Demographics Similar to Immigrants from Israel by Bachelor's Degree
In terms of bachelor's degree, the demographic groups most similar to Immigrants from Israel are Thai (50.1%, a difference of 0.24%), Immigrants from Iran (50.3%, a difference of 0.61%), Okinawan (50.5%, a difference of 1.1%), Iranian (51.0%, a difference of 1.9%), and Cypriot (49.0%, a difference of 1.9%).
| Demographics | Rating | Rank | Bachelor's Degree |
| Immigrants | Singapore | 100.0 /100 | #2 | Exceptional 51.9% |
| Immigrants | India | 100.0 /100 | #3 | Exceptional 51.3% |
| Immigrants | Taiwan | 100.0 /100 | #4 | Exceptional 51.2% |
| Iranians | 100.0 /100 | #5 | Exceptional 51.0% |
| Okinawans | 100.0 /100 | #6 | Exceptional 50.5% |
| Immigrants | Iran | 100.0 /100 | #7 | Exceptional 50.3% |
| Thais | 100.0 /100 | #8 | Exceptional 50.1% |
| Immigrants | Israel | 100.0 /100 | #9 | Exceptional 50.0% |
| Cypriots | 100.0 /100 | #10 | Exceptional 49.0% |
| Immigrants | Australia | 100.0 /100 | #11 | Exceptional 48.5% |
| Immigrants | China | 100.0 /100 | #12 | Exceptional 48.4% |
| Immigrants | South Central Asia | 100.0 /100 | #13 | Exceptional 48.3% |
| Immigrants | Hong Kong | 100.0 /100 | #14 | Exceptional 48.2% |
| Immigrants | Eastern Asia | 100.0 /100 | #15 | Exceptional 48.1% |
| Soviet Union | 100.0 /100 | #16 | Exceptional 47.9% |